Github Style Heatmap Graph Plugin With jQuery - Calmosaic
| File Size: | 19.4 KB |
|---|---|
| Views Total: | 2999 |
| Last Update: | |
| Publish Date: | |
| Official Website: | Go to website |
| License: | MIT |
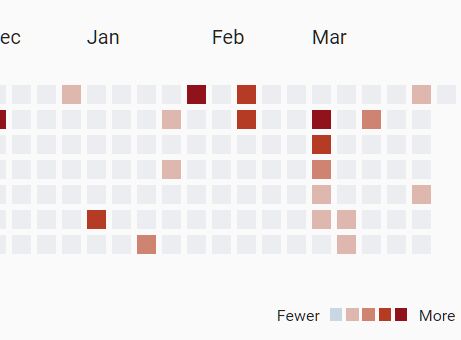
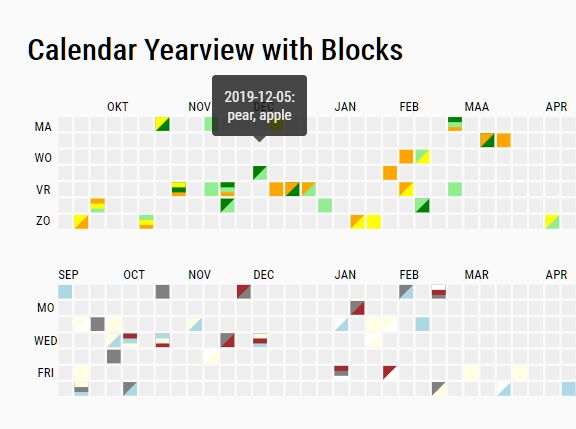
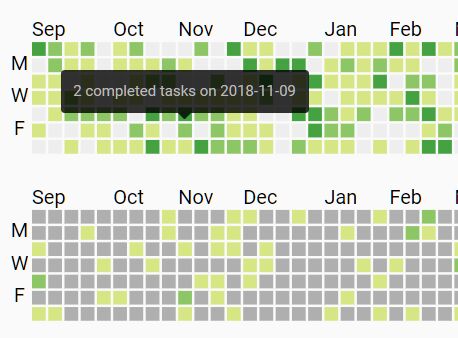
Calmosaic (Calendar Mosaic) is a jQuery plugin that dynamically renders a customizable calendar heatmap for representing time series data. Inspired by Github's contribution chart.
How to use it:
1. To get started, include the necessary jQuery and Moment.js libraries.
<script src="/path/to/jquery.min.js"></script>
<script src="/path/to/moment.min.js"></script>
2. Include the jQuery Calmosaic plugin's files on the page.
<link rel="stylesheet" href="dist/jquery.calmosaic.min.css">
<script src="dist/jquery.calmosaic.min.js"></script>
3. Create a container in which the heatmap will render.
<div id="heatmap-container"></div>
4. Prepare your data containing dates and event counts ina JS object or array.
const myData = [
      {
        count: 2,
        date: "2018-09-23"
      },{
        count: 5,
        date: "2018-10-23"
      }
      // ...
]

// or
const myData = [ "2018-09-23", "2018-10-23", ...]

// or
const myData = { "2018-09-23: 2, "2018-10-23": 5, ...}
5. Populate the heatmap. Done.
$(function(){
  $("#heatmap-container").calmosaic(myData);
});
6. All default options to customize the heatmap.
$("#heatmap-container").calmosaic(myData,{

  // heatmap title
  title: null,

  // the number of months
  months: 12,

  // last month
  lastMonth: moment().month() + 1,

  // last year
  lastYear: moment().year(),

  // gradients
  // 'Earth', 'Electric', 'Viridis'
  // 'Picknick', 'Green'
  // 'Blue', 'Red', 'Teal'
  coloring: null,

  // lables options
  labels: {
    days: false,
    months: true,
    custom: {
      weekDayLabels: null,
      monthLabels: null
    }
  },

  // legend options
  legend: {
    show: true,
    align: "right",
    minLabel: "Less",
    maxLabel: "More"
  }

});
This awesome jQuery plugin is developed by routekick. For more Advanced Usages, please check the demo page or visit the official website.