Click Heat Map Generator With jQuery And Canvas - Heatmap.js
| File Size: | 7.95 KB |
|---|---|
| Views Total: | 2475 |
| Last Update: | |
| Publish Date: | |
| Official Website: | Go to website |
| License: | MIT |
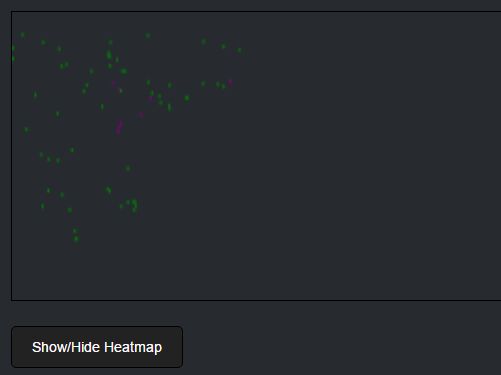
Heatmap.js is a very light (3kb unminified) jQuery plugin that lets you generate a click heat map on an HTML5 canvas element to visualize where your visitors left or right click on the web content.
How to use it:
1. Load the jQuery heatmap.js plugin along with the latest jQuery library in the html document.
<script src="//code.jquery.com/jquery-3.2.1.slim.min.js"></script>
<script src="js/jquery.heatmap.js"></script>
2. That's it. The plugin will automatically generate a canvas based click heat map on your webpage. The html structure should be like this:
<div id="heatmapDiv1" style="">
  <p id="heatmapP1">0</p>
  <canvas id="heatmapCanvas1" style="width: 560px; height: 290.333px; border: 1px solid black;"></canvas>
</div>
3. Style the Heat Map Generator in the CSS whatever you like:
#heatmapDiv1 {
  /* container styles */
}

#heatmapP1 {
  /* counter styles */
}

#heatmapCanvas1 {
  /* canvas styles */
}
4. The default heat map options.
{

  // Sets the starting number for counting
  count: 0,

  // Enables/disables counting
  disableCount: false,

  // Enables/disables the button
  disableButton: false,

  // The refresh speed of the shown count number
  refreshSpeed: 300,

  // Multiplies the heatmap's size with the given value
  resize: 1,

};
Change log:
2017-09-05
- Added white space for readability.
2017-07-26
- New options.
2017-07-19
- Changed the style to increase readability.
This awesome jQuery plugin is developed by onatuner. For more Advanced Usages, please check the demo page or visit the official website.