Dynamic Segmented Bar Chart In jQuery - segbar.js
| File Size: | 4.98 KB |
|---|---|
| Views Total: | 5200 |
| Last Update: | |
| Publish Date: | |
| Official Website: | Go to website |
| License: | MIT |
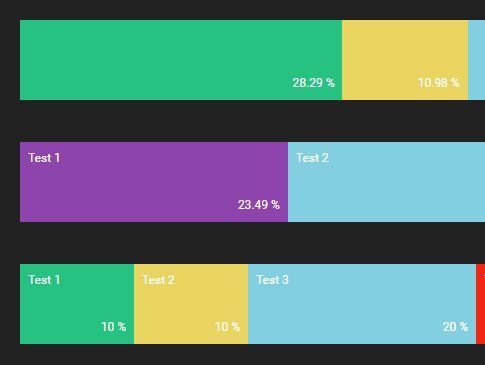
segbar.js is a lightweight jQuery plugin that lets you render responsive, dynamic, horizontal Segmented Bar Charts from JSON objects.
See also:
How to use it:
1. Include jQuery JavaScript library (slim build is recommended) and the jQuery segbar.js script on the web page.
<script src="//code.jquery.com/jquery-3.2.1.slim.min.js"></script>
<script src="segbar.js"></script>
2. Create a placeholder element for the segmented bar chart.
<div class="chart"></div>
3. Call the function and specify the numeric values as these:
$('.chart').segbar([
  {
    data: [
      {  value: 16744 },
      {  value: 6500 },
      {  value: 32750 },
      {  value: 3200 }
    ]
  },

  // or

  {
    data: [
      { title: 'Test 1', value: 6.87, color: '#8E44AD' },
      { title: 'Test 2', value: 14.56, color: '#81CFE0' },
      { title: 'Test 3', value: 7.82, color: '#EB974E' }
    ]
  },

  // or

  {
    data: [
      { title: 'Test 1', value: 10 },
      { title: 'Test 2', value: 10 },
      { title: 'Test 3', value: 20 },
      { title: 'Test 4', value: 5 },
      { title: 'Test 5', value: 30 },
      { title: 'Test 6', value: 5 },
      { title: 'Test 7', value: 20 }
    ]
  }
])
4. Adjust the height & width of the segmented bar chart.
$('.chart').segbar({
  width: "100%",
  height: "80px"
})
5. The default color palette for the segmented bar chart.
palette = [
  '#26C281',
  '#E9D460',
  '#81CFE0',
  '#F22613',
  '#3A539B',
  '#E67E22',
  '#22A7F0',
  '#C0392B',
  '#663399',
  '#913D88',
  '#F9BF3B',
  '#6C7A89',
  '#DB0A5B',
  '#03A678',
  '#FDE3A7',
  '#6BB9F0',
  '#8E44AD',
  '#D24D57',
  '#CF000F',
  '#86E2D5'
];
This awesome jQuery plugin is developed by dimlucas. For more Advanced Usages, please check the demo page or visit the official website.


