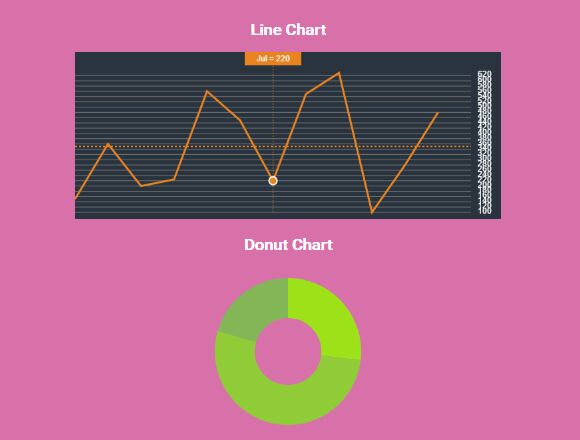
Responsive Customizable Line Chart Generator - jQuery Graphiq
| File Size: | 14.2 KB |
|---|---|
| Views Total: | 2642 |
| Last Update: | |
| Publish Date: | |
| Official Website: | Go to website |
| License: | MIT |

A lightweight (~3kb minified) jQuery plugin that makes it easier to generate responsive, customizable, scalable SVG line charts using plain JavaScript, CSS, and HTML.
It comes with many options to customize the line chart, such as Responsive Layout, Color , Width, Height, Y-Axis Label, X-Axis label, Color Fill, and more.
How to use it:
1. Download and load the Graphiq plugin after jQuery.
<script src="/path/to/cdn/jquery.min.js"></script>
<script src="/path/to/graphiq.min.js"></script>
2. Create a container to hold the line graph.
<div class="example"></div>
3. Define your data in a JS object as follows:
var songs = {
    "Mon" : 80,
    "Tues": 40,
    "Wed" : 60,
    "Thu" : 80,
    "Fri": 40,
    "Sat" : 60,
};
4. Initialize the plugin to draw a basic line graph:
$('.example').graphiq({
  data: songs,
});
5. Customize the line graph by passing the following options to the graphiq():
$('.example').graphiq({
  data: songs,
  colorLine: "#d3a2ef",
  colorDot: "#c3ecf7",
  colorXGrid: "#7f7f7f",
  colorYGrid: "#7f7f7f",
  colorLabels: "#FFFFFF",
  colorUnits: "#FFFFFF",
  colorRange: "#FFFFFF",
  colorFill: "#533c68",
  colorDotStroke: "#FFFFFF",
  dotStrokeWeight: 0,
  fillOpacity: 0.25,
  rangeOpacity: 0.5,
  dotRadius: 3,
  lineWeight: 2,
  yLines: true,
  dots: true,
  xLines: true,
  xLineCount: 5,
  fill: true,
  height: 100,
  fluidParent: null
});
This awesome jQuery plugin is developed by kylewetton. For more Advanced Usages, please check the demo page or visit the official website.