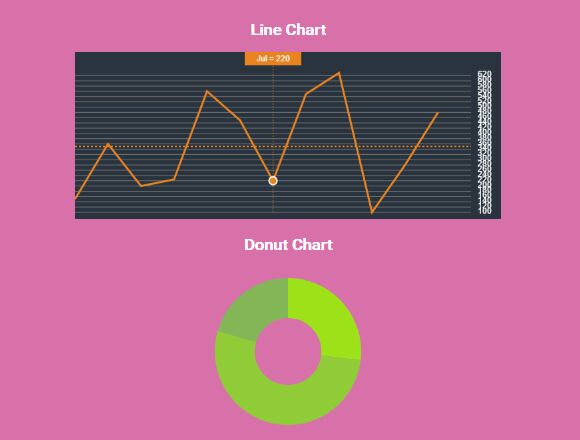
Basic Line Chart Plugin For jQuery - blueberryCharts.js
| File Size: | 8.27 KB |
|---|---|
| Views Total: | 4476 |
| Last Update: | |
| Publish Date: | |
| Official Website: | Go to website |
| License: | MIT |

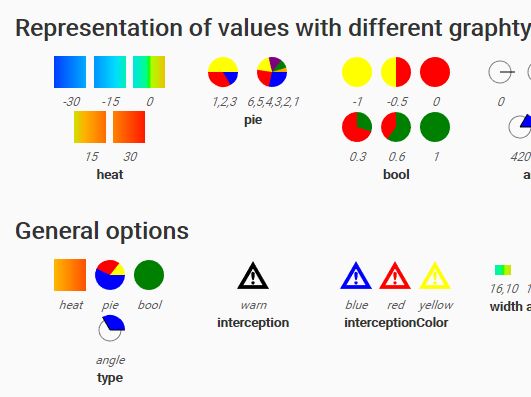
blueberryCharts.js is a small jQuery plugin which helps you draw dynamic, interactive, pretty nice, multi-series line charts using SVG elements.
How to use it:
1. Import jQuery JavaScript library together with the blueberryCharts.css and blueberryCharts.js into the document.
<link rel="stylesheet" href="blueberryCharts.css">
<script src="https://code.jquery.com/jquery-3.2.1.slim.min.js"
        integrity="sha384-KJ3o2DKtIkvYIK3UENzmM7KCkRr/rE9/Qpg6aAZGJwFDMVNA/GpGFF93hXpG5KkN"
        crossorigin="anonymous"></script>
<script src="blueberryCharts.js"></script>
2. Create a container element in which you want to place the line chart.
<div class="blueberryChart demo"></div>
3. Prepare your data to be plotted to the line chart.
var myDate = [
    [0, 20, 33, 10, 54, 90, 70, 84, 95, 100],
    [0, 30, 23, 20, 44, 60, 10, 50, 10, 40]
],
4. The JavaScript to draw a basic line chart inside the container you just created.
$('.demo').blueberryChart({
  chartData: myData
});
5. More configuration to customize the line chart as per your needs.
$('.demo').blueberryChart({

  // shows lines
  showLines: true,

  // shows dots
  showDots: false,

  // an array of line colors
  lineColors: ['#FF5252', '#777777']

});
This awesome jQuery plugin is developed by iseries. For more Advanced Usages, please check the demo page or visit the official website.