Create Timeline Style Graphs With jQuery And Raphaël - Timeline.js
| File Size: | 14.2 KB |
|---|---|
| Views Total: | 9705 |
| Last Update: | |
| Publish Date: | |
| Official Website: | Go to website |
| License: | MIT |
The Timeline.js jQuery plugin makes use of Raphaël.js library to create complex, cross-browser, timeline-style, vector shaped graphs from nested JSON data.
How to use it:
1. Place the main style sheet timeline.css in the header of the document.
<link href="timeline.css" rel="stylesheet">
2. Place the JavaScript file Timeline.js and other required resources at the end of the document.
<!--[if (gt IE 8)|!(IE)]><!-->
<script src="https://code.jquery.com/jquery-3.2.1.slim.min.js" integrity="sha384-KJ3o2DKtIkvYIK3UENzmM7KCkRr/rE9/Qpg6aAZGJwFDMVNA/GpGFF93hXpG5KkN" crossorigin="anonymous"></script>
<script src="https://cdnjs.cloudflare.com/ajax/libs/raphael/2.2.7/raphael.min.js"></script>
<!--<![endif]-->

<!--[if lt IE 9]>
<script src="https://code.jquery.com/jquery-1.12.4.min.js"></script>
<script src="https://cdnjs.cloudflare.com/ajax/libs/raphael/2.2.7/raphael.min.js"></script>
<![endif]-->
3. Create a placeholder element for the graph.
<div id="demo"></div>
4. Prepare your data as these:
var myOption = {
legend: [{
text: "Text 1",
name: "1",
icon: "1.png"
}, {
text: "Text 2",
name: "2",
icon: "2.png"
}, {
text: "Text 3",
name: "3",
icon: "3.png"
}],
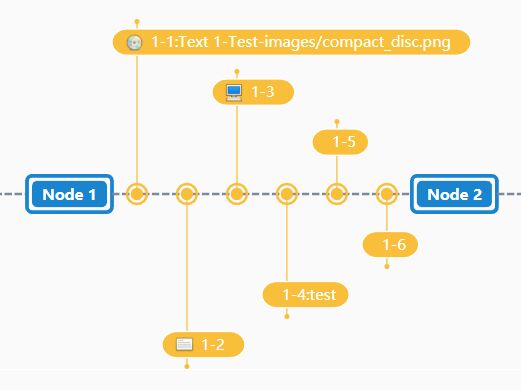
data: [{
text: "Node 1",
children: [{
text: "1-1",
legendName: "1",
imageUrl: ""
}, {
text: "1-2",
legendName: "2",
imageUrl: ""
}, {
text: "1-3",
legendName: "3",
imageUrl: ""
}, {
text: "1-4:test",
legendName: "4",
imageUrl: ""
}, {
text: "1-5",
legendName: "5",
imageUrl: ""
}, {
text: "1-6",
legendName: "6",
imageUrl: ""
}]
},
{
text: "Node 2"
},
{
text: "Node 3",
children: [{
text: "1-1",
legendName: "1",
imageUrl: ""
}, {
text: "1-2",
legendName: "2",
imageUrl: ""
}, {
text: "1-3",
legendName: "3",
imageUrl: ""
}, {
text: "1-4:test",
legendName: "4",
imageUrl: ""
}, {
text: "1-5",
legendName: "5",
imageUrl: ""
}, {
text: "1-6",
legendName: "6",
imageUrl: ""
}]
},
{
text: "Node 4"
}]
};
5. Generate a graph inside the placeholder element.
$("#demo").timeline(myOption);
6. Override the default styles of the graph.
myOption.theme = {
  lengend: {
      fill: "#000000",
  },
  startNode: {
      radius: 10,
      fill: "#7E899D"
  },
  endNode: {
      radius: 10,
      fill: "#7E899D"
  },
  centralAxisNode: {
      height: 21,
      radius: 4,
      fill: "#1A84CE",
      color: "#ffffff",
      inner: {
          fill: "#1A84CE",
          "stroke-width": 0,
          stroke: "#1A84CE"
      },
      outer: {
          fill: "#1A84CE",
          "stroke-width": 3,
          stroke: "#1A84CE"
      }
  },
  centralAxisLine: {
      fill: "#7E899D"
  },
  centralAxisBranchNode: {
      fill: "#F9BF3B",
      radius: 10
  },
  centralAxisBranchLine: {
      stroke: '#F9BF3B',
      fill: "#F9BF3B"
  },
  centralAxisBranchContent: {
      fill: "#F9BF3B",
      color: "#ffffff",
      stroke: '#ffffff',
      height: 24
  }
}
This awesome jQuery plugin is developed by huang-qing. For more Advanced Usages, please check the demo page or visit the official website.