Dynamic Line Chart With Grid Lines - jQuery LineChart
| File Size: | 15.3 KB |
|---|---|
| Views Total: | 1673 |
| Last Update: | |
| Publish Date: | |
| Official Website: | Go to website |
| License: | MIT |
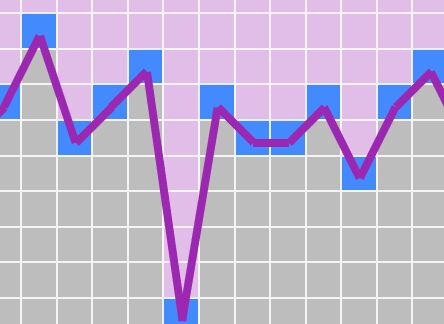
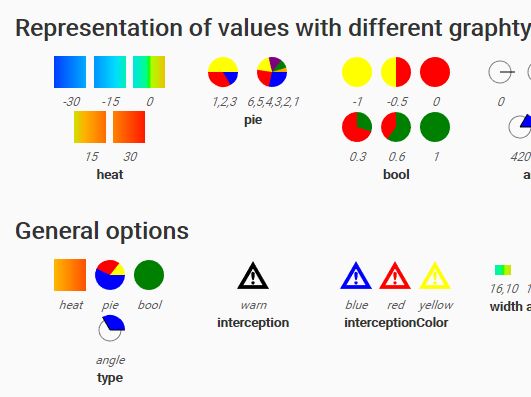
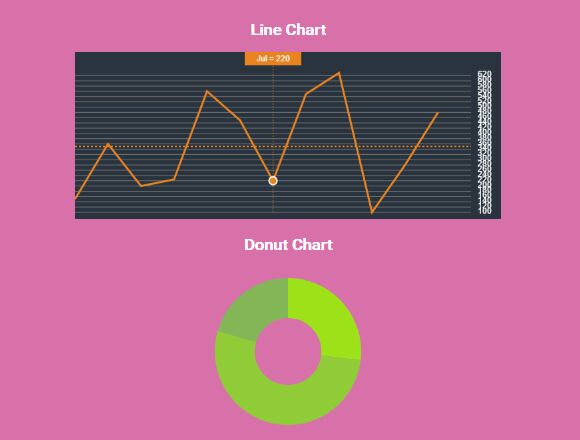
A lightweight and easy-to-use jQuery plugin to dynamically render a line chart with marks, gridlines and interlaced colors.
Currently comes with 3 themes (default, grey and purple) and easy to create your own themes in the CSS.
How to use it:
1. Load jQuery together with the jQuery LineChart plugin's files in the html page.
<link rel="stylesheet" href="scale.css">
<script src="https://code.jquery.com/jquery-3.3.1.min.js"
        integrity="sha384-tsQFqpEReu7ZLhBV2VZlAu7zcOV+rXbYlF2cqB8txI/8aZajjp4Bqd+V6D5IgvKT"
        crossorigin="anonymous">
</script>
<script src="scale.js"></script>
2. Create a placeholder element for the line chart.
<div id="myChart"></div>
3. Prepare your data to visualize in the line chart.
var myData = [
    item1: {
      value: 'Value 1',
      title: 'Title 1'
    },
    item2: {
      value: 'Value 2',
      title: 'Title 2'
    },
    item3: {
      value: 'Value 3',
      title: 'Title 3'
    },
    // ...
]
4. Plot your data to a line.
$("#chart").linechart({
  data: items,
  line: true // default: false
});
5. Set the height/width of the line chart.
$("#chart").linechart({
  width: 30, // default: 50
  height: 10, // default: 50
});
6. Set the size of the grid box.
$("#chart").linechart({
  boxSize: 16, // default: 20
});
7. Change the default theme.
$("#chart").linechart({
  theme: "default" // purple, grey
});
8. Create your own themes as follows:
.yourTheme .mark {
  background: #9E9E9E;
}

.yourTheme .empty {
  background: #FFFFFF;
}

.yourTheme .painted {
  background: #CFD8DC;
}

.yourTheme .line {
  border: 2px solid #455A64;
}
This awesome jQuery plugin is developed by chartify. For more Advanced Usages, please check the demo page or visit the official website.