Dynamic Chart Generator With jQuery And D3.js - D3-Instant-Charts
| File Size: | 10.6 KB |
|---|---|
| Views Total: | 7373 |
| Last Update: | |
| Publish Date: | |
| Official Website: | Go to website |
| License: | MIT |

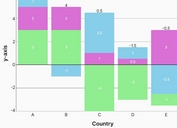
D3-Instant-Charts is a jQuery chart plugin which helps you dynamically generate customizable, SVG-based bar and line charts from JSON data using the latest d3.js library.
Licensed under the BSD 2-clause License.
How to use it:
1. Load the needed jQuery and d3.js libraries from CDN.
<script src="https://code.jquery.com/jquery-3.3.1.min.js"
        integrity="sha256-FgpCb/KJQlLNfOu91ta32o/NMZxltwRo8QtmkMRdAu8="
        crossorigin="anonymous"></script>
<script src="https://d3js.org/d3.v5.min.js"
        integrity="sha384-HL96dun1KbYEq6UT/ZlsspAODCyQ+Zp4z318ajUPBPSMzy5dvxl6ziwmnil8/Cpd"
        crossorigin="anonymous">
</script>
2. Generate a bar chart from JSON.
<div id="bar-chart-demo"></div>
// bar-chart.json
{
   "d3chart":[
      {
         "name":"DataH",
         "value":56
      },
      {
         "name":"DataM",
         "value":54
      },
      {
         "name":"DataT",
         "value":54
      }
   ]
}
$('#bar-chart-demo').barChart({
  jsonUrl: 'json/bar-chart.json'
});
3. Generate a line chart from JSON.
<div id="line-chart-demo"></div>
// line-chart.json
{
   "d3chart":[
      {
         "name":"Data01",
         "values":[
            {
               "x":"2018-02",
               "y":705
            },
            {
               "x":"2018-03",
               "y":120
            },
            {
               "x":"2018-04",
               "y":525
            },
            {
               "x":"2018-05",
               "y":355
            },
            {
               "x":"2018-06",
               "y":122
            },
            {
               "x":"2018-07",
               "y":212
            }
         ]
      },
      {
         "name":"Data02",
         "values":[
            {
               "x":"2018-02",
               "y":386
            },
            {
               "x":"2018-03",
               "y":925
            },
            {
               "x":"2018-04",
               "y":254
            },
            {
               "x":"2018-05",
               "y":238
            },
            {
               "x":"2018-06",
               "y":254
            },
            {
               "x":"2018-07",
               "y":651
            }
         ]
      }
   ]
}
$('#line-chart-demo').lineChart({
  jsonUrl: 'json/line-chart.json'
});
4. Default options to customize the line & bar charts.
// bar chart options
$('#bar-chart-demo').barChart({
  jsonUrl: '',
  width: svgDefaultWidth,
  height: svgDefaultHeight,
  marginTop: 30,
  marginRight: 30,
  marginButtom: 50,
  marginLeft: 20,
  barSpacing: 0.1,
  barWidthRate: 0.3,
  axisXScaleCount: 10,
  axisYPadding: 0,
  axisYPaddingEllipses: '…',
  autoFitAxisY: true,
  autoFitScaling: 1,
  toolTipFormat: '{%name%} - {%value%}',
  ajaxType: 'GET',
  blankDataMessage: 'No Data Available.'
});

// line chart options
$('#line-chart-demo').lineChart({
  jsonUrl: '',
  width: svgDefaultWidth,
  height: svgDefaultHeight,
  marginTop: 50,
  marginRight: 50,
  marginButtom: 50,
  marginLeft: 50,
  axisYScaleCount: 10,
  toolTipFormat: '{%name%}: {%values.x%} - {%values.y%}',
  xAxisTimeFormat: '%Y/%m',
  legendWidthRate: 0.5,
  ajaxType: 'GET',
  blankDataMessage: 'No Data Available.'
});
This awesome jQuery plugin is developed by forink. For more Advanced Usages, please check the demo page or visit the official website.
