Simple Animated Column Chart In JavaScript - Barchart.js
| File Size: | 19 KB |
|---|---|
| Views Total: | 2710 |
| Last Update: | |
| Publish Date: | |
| Official Website: | Go to website |
| License: | MIT |
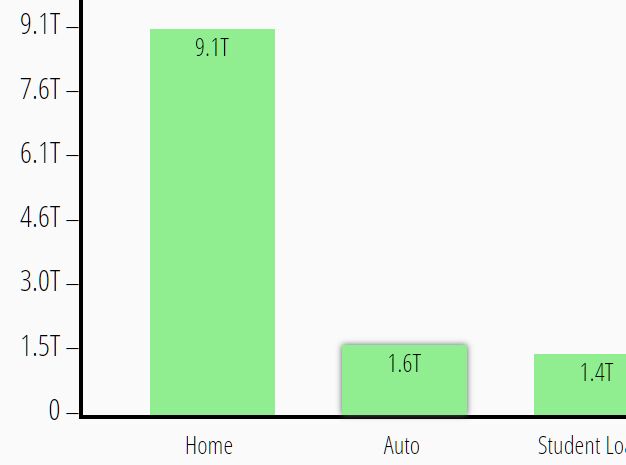
Barchart.js is a tiny and easy JavaScript plugin to render an animated column chart from an array of n data arrays you provide.
Can be implemented in jQuery or Vanilla JavaScript.
More Features:
- Custom labels & ticks.
- Auto formats larger numbers so they fit on bars and ticks.
- Easy to customize the appearance in the JavaScript.
- No SVG. No Canvas. Built using plain JavaScript and CSS.
How to use it:
1. Include the Barchart.js plugin's files on the webpage. Note that the jQuery library is OPTIONAL.
<link rel="stylesheet" href="barchart.css" />
<script src="https://code.jquery.com/jquery.min.js"></script>
<script src="barchart.js"></script>
2. Create a container element that the chart will be generated inside of.
<div id="chart-example"></div>
3. Define your chart data in an array of n arrays, each of length 2. The first value in the n'th array couple is a String that represents that bar's label. The second value in each array couple is a number and represents the value of the associated bar.
let data = [
    ['Oranges', 23],
    ['Apples', 44],
    ['Pears', 7]
];
4. Call the createBarChart() method to generate a basic column chart. Use either a jQuery or vanilla DOM selector for the element argument.
// createBarChart(data, element, options);
const chart = document.getElementById('chart-example');
createBarChart(data, chart);
5. This is a full list of available options to customize the appearance of the column chart.
const options = {
      width: 320,
      height: 320,
      title: 'Bar Chart',
      titleFontSize: 18,
      titleBG: '#f7f7f7',
      titleColor: 'black',
      barColors: ['grey'],
      labelColors: ['black'],
      labelPos: 'center',
      axisColor: 'black',
      axisWidth: 3,
      barSpacing: 0.6,
      ticks: 4
};
This awesome jQuery plugin is developed by bryce-mcmath. For more Advanced Usages, please check the demo page or visit the official website.


