Horizontal Bar Chart Plugin - jQuery Devstratum JQP Graph
| File Size: | 11.1 KB |
|---|---|
| Views Total: | 4056 |
| Last Update: | |
| Publish Date: | |
| Official Website: | Go to website |
| License: | MIT |
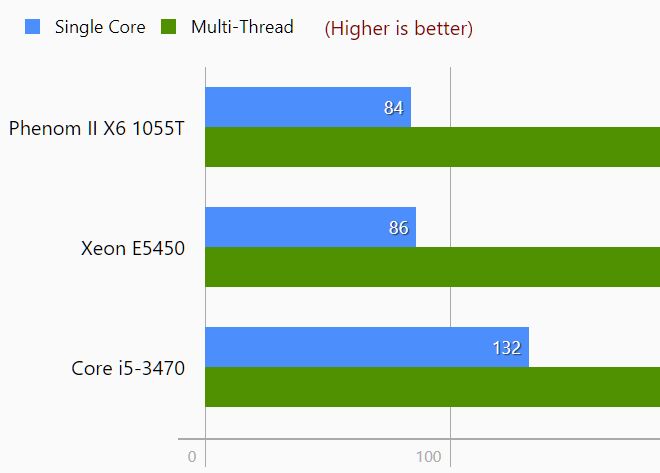
Devstratum JQP Graph is a tiny jQuery plugin for plotting your numeric values in horizontal bar charts with titles, descriptions, labels, legends, x-axis/y-axis grids support.
How to use it:
1. To use the plugin, include the following JavaScript and CSS files on the HTML page.
<link href="/path/to/dvstrtm_jqp_graph.min.css" rel="stylesheet" />
<script src="/path/to/cdn/jquery.min.js"></script>
<script src="/path/to/dvstrtm_jqp_graph.min.js"></script>
2. Create an element to hold the horizontal bar chart.
<div class="graph__block" id="example"></div>
3. Define the data to be visualized in the bar chart.
var myData = [
    {
        label: 'Phenom II X6 1055T',
        value: [
            336
        ]
    },
    {
        label: 'Xeon E5450',
        value: [
            470
        ]
    },
    {
        label: 'Core i5-3470',
        value: [
            337
        ]
    }
]
4. It also allows you to visualize large chunks of data in a stacked bar chart.
var myData = [
    {
        label: 'Phenom II X6 1055T',
        color: [
            'blue',
            'green',
            'orange'
        ],
        value: [
            3069,
            5999,
            8252,
        ]
    },
    {
        label: 'Xeon E5450',
        color: [
            'blue',
            'green',
            'orange'
        ],
        value: [
            2863,
            5120,
            7927,
        ]
    },
    {
        label: 'Core i5-3470',
        color: [
            'blue',
            'green',
            'orange'
        ],
        value: [
            4047,
            6489,
            9143,
        ]
    }
]
5. Plot the data into the bar chart and done.
$('#example').dvstrtm_graph({
  title: 'Chart Title',
  unit: 'Seconds', // sub title
  better: 'Lower is better', // description
  graphs: myData
});
6. Full plugin options to customize the bar chart.
$('#example').dvstrtm_graph({
  theme: 'light', // or 'dark'
  title: '',
  description: '',
  unit: '',
  better: '',
  type: 'number', // or 'time'
  separate: false,
  labels: true,
  grid_wmax: 0,
  grid_part: 5,
  points: [],
  graphs: []
});
Changelog:
2022-03-22
- v1.6: update
2021-12-01
- v1.5: Changed function name.
2020-09-22
- v1.1
This awesome jQuery plugin is developed by devstratum. For more Advanced Usages, please check the demo page or visit the official website.


