Interactive Charts JS Library - Highcharts
| File Size: | 5 MB |
|---|---|
| Views Total: | 4649 |
| Last Update: | |
| Publish Date: | |
| Official Website: | Go to website |
| License: | MIT |
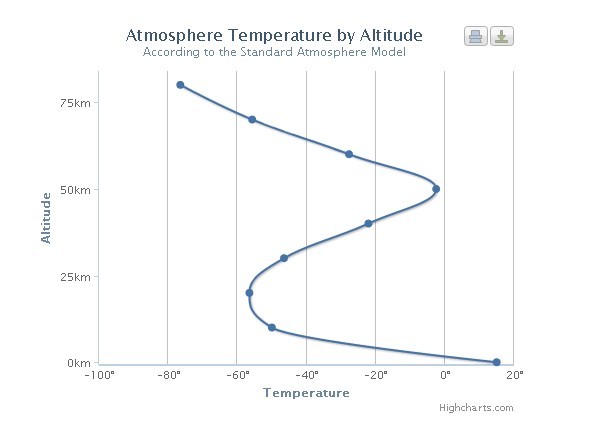
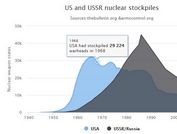
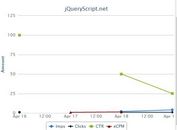
Highcharts is a powerful javascript library works with jQuery for adding a variety of interactive charts to your projects or applications. It can help you create Line and scatter charts, Area charts, Column and bar charts, Pie charts, Dynamic charts, Combinations, and other more chart types.
Basic usage (Basic Line Chart):
1. Include jQuery Library and Highcharts.js in your head section
<script type="text/javascript" src="http://ajax.googleapis.com/ajax/libs/jquery/1.9.0/jquery.min.js"></script>
<script src="http://code.highcharts.com/highcharts.js"></script>
2. Initialize the chart
<script type="text/javascript">
$(function () {
    var chart;
    $(document).ready(function() {
        chart = new Highcharts.Chart({
            chart: {
                renderTo: 'container',
                type: 'line',
                marginRight: 130,
                marginBottom: 25
            },
            title: {
                text: 'Monthly Average Temperature',
                x: -20 //center
            },
            subtitle: {
                text: 'Source: WorldClimate.com',
                x: -20
            },
            xAxis: {
                categories: ['Jan', 'Feb', 'Mar', 'Apr', 'May', 'Jun',
                    'Jul', 'Aug', 'Sep', 'Oct', 'Nov', 'Dec']
            },
            yAxis: {
                title: {
                    text: 'Temperature (°C)'
                },
                plotLines: [{
                    value: 0,
                    width: 1,
                    color: '#808080'
                }]
            },
            tooltip: {
                formatter: function() {
                        return '<b>'+ this.series.name +'</b><br/>'+
                        this.x +': '+ this.y +'°C';
                }
            },
            legend: {
                layout: 'vertical',
                align: 'right',
                verticalAlign: 'top',
                x: -10,
                y: 100,
                borderWidth: 0
            },
            series: [{
                name: 'Tokyo',
                data: [7.0, 6.9, 9.5, 14.5, 18.2, 21.5, 25.2, 26.5, 23.3, 18.3, 13.9, 9.6]
            }, {
                name: 'New York',
                data: [-0.2, 0.8, 5.7, 11.3, 17.0, 22.0, 24.8, 24.1, 20.1, 14.1, 8.6, 2.5]
            }, {
                name: 'Berlin',
                data: [-0.9, 0.6, 3.5, 8.4, 13.5, 17.0, 18.6, 17.9, 14.3, 9.0, 3.9, 1.0]
            }, {
                name: 'London',
                data: [3.9, 4.2, 5.7, 8.5, 11.9, 15.2, 17.0, 16.6, 14.2, 10.3, 6.6, 4.8]
            }]
        });
    });

});
</script>
3. The Markup
<div id="container"></div>
This awesome jQuery plugin is developed by highcharts. For more Advanced Usages, please check the demo page or visit the official website.
