JS Interactive Visualizations Charts Library with HTML5 - dygraphs
| File Size: | 6.18 MB |
|---|---|
| Views Total: | 2933 |
| Last Update: | |
| Publish Date: | |
| Official Website: | Go to website |
| License: | MIT |
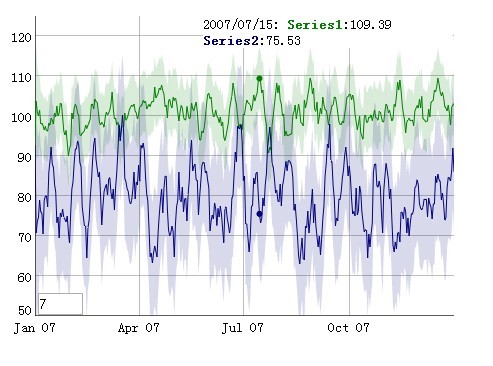
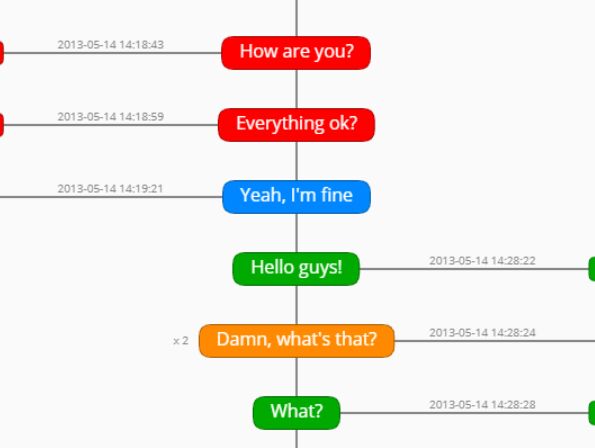
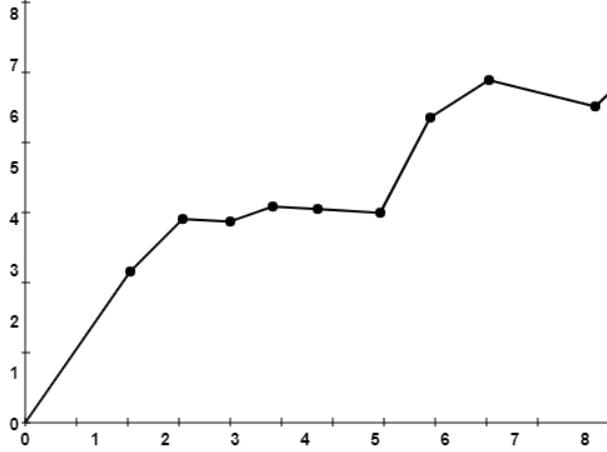
dygraphs is a javascript library for creating responsive, interactive and customizable charts with HTML5 canvas tag for your projects. It supports multiple data series, error bands around data series and can display values on mouseover. dygraphs is a lightweight JS library and ompatible with the Google Visualization API.
Basic Usage:
1. Include dygraphs.js
<script type="text/javascript" src="dygraph-combined.js"></script>
2. Markup
<div id="graphdiv"></div>
3. Call the function
<script type="text/javascript">
            g = new Dygraph(

              // containing div
              document.getElementById("graphdiv"),

              // CSV or path to a CSV file.
              "Date,Temperature\n" +
              "2008-05-07,75\n" +
              "2008-05-08,70\n" +
              "2008-05-09,80\n"
            );
</script>
This awesome jQuery plugin is developed by unknown. For more Advanced Usages, please check the demo page or visit the official website.