Lightweight Chart Plugin With jQuery and CSS - cssCharts.js
| File Size: | 13.4 KB |
|---|---|
| Views Total: | 16520 |
| Last Update: | |
| Publish Date: | |
| Official Website: | Go to website |
| License: | MIT |
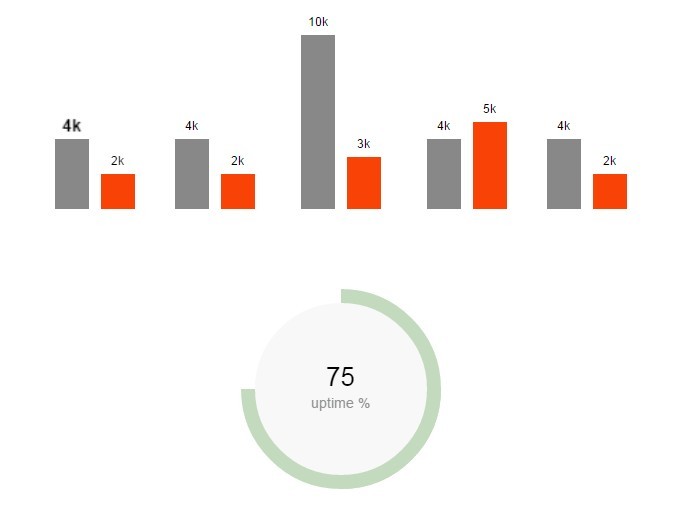
cssCharts.js is a simple lightweight jQuery chart plugin which uses plain Html5/CSS to plot data as charts, donuts or lines.
How to use it:
1. Load jQuery library and the jQuery cssCharts.js plugin's JavaScript & Stylesheet in the webpage.
<script src="//code.jquery.com/jquery-2.1.3.min.js"></script>
<link rel="stylesheet" href="chart.css">
<script src="jquery.chart.js"></script>
2. Add your dataset into the container using Html5 data-* attibutes.
<div class="bar-chart"
     data-bars="[[4,2],[4,5],[10,3],[4,2],[4,2]]"
     data-max="10"
     data-unit="k"
     data-grid="0">
</div>

<div class="donut-chart"
     data-percent="0.75"
     data-title="uptime %">
</div>

<div class="line-chart"
     data-cord="[12,92,40,2,40,102],[120,70,40,90,40,60]" >
</div>
3. The JavaScript to generate charts.
$('.bar-chart').cssCharts({type:"bar"});
$('.donut-chart').cssCharts({type:"donut"}).trigger('show-donut-chart');
$('.line-chart').cssCharts({type:"line"});
Change logs:
2016-06-01
- Fix Data-percentage Error
2015-06-01
- CSS & demo update.
2015-05-09
- make line graph responsive
2015-05-08
- add legend to pie chart.
2015-05-04
- Added support for multiple line charts
- Added no-points line chart
2015-05-02
- v0.2.0
2015-05-01
- implement fill for line chart
2015-04-30
- enable set barChart bar width via data-width attribute.
2015-04-29
- update & fix
2015-03-30
- fix style exposed to global elements
This awesome jQuery plugin is developed by thysultan. For more Advanced Usages, please check the demo page or visit the official website.


