jQuery Plugin To Generate Google Charts From Tables - gvChart
| File Size: | 5.28 KB |
|---|---|
| Views Total: | 5557 |
| Last Update: | |
| Publish Date: | |
| Official Website: | Go to website |
| License: | MIT |
gvChart is a minimal yet accessibility jQuery plugin that renders interactive Google charts from existing data tables to visualize data on your website. You can add aria-hidden attributes to give screen readers access to the table.
How to use it:
1. Include the latest version of jQuery library and gvChart.js script in the document.
<script src="//ajax.googleapis.com/ajax/libs/jquery/1.11.1/jquery.min.js"></script>
<script src="jquery.gvChart.min.js"></script>
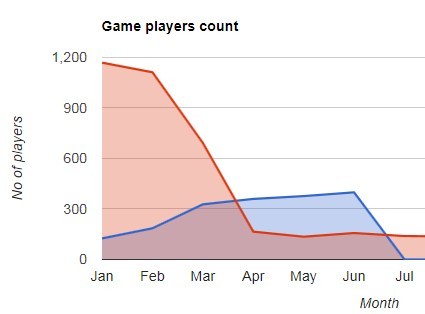
2. Create a sample table with data about number of a new players on the page on every month. There're two data sets, each for one year: 2009 and 2010. They can be shown as a separate data on the chart.
<table id="demo">
  <thead>
    <tr>
      <th></th>
      <th>Jan</th>
      <th>Feb</th>
      <th>Mar</th>
      <th>Apr</th>
      <th>May</th>
      <th>Jun</th>
      <th>Jul</th>
      <th>Aug</th>
      <th>Sep</th>
      <th>Oct</th>
      <th>Nov</th>
      <th>Dec</th>
    </tr>
  </thead>
  <tbody>
    <tr>
      <th>2010</th>
      <td>125</td>
      <td>185</td>
      <td>327</td>
      <td>359</td>
      <td>376</td>
      <td>398</td>
      <td>0</td>
      <td>0</td>
      <td>0</td>
      <td>0</td>
      <td>0</td>
      <td>0</td>
    </tr>
    <tr>
      <th>2009</th>
      <td>1167</td>
      <td>1110</td>
      <td>691</td>
      <td>165</td>
      <td>135</td>
      <td>157</td>
      <td>139</td>
      <td>136</td>
      <td>938</td>
      <td>1120</td>
      <td>55</td>
      <td>55</td>
    </tr>
  </tbody>
</table>
3. Call the plugin with options and set the chartType for your Google chart.
googleLoaded.done( function(){
$('#demo').gvChart({
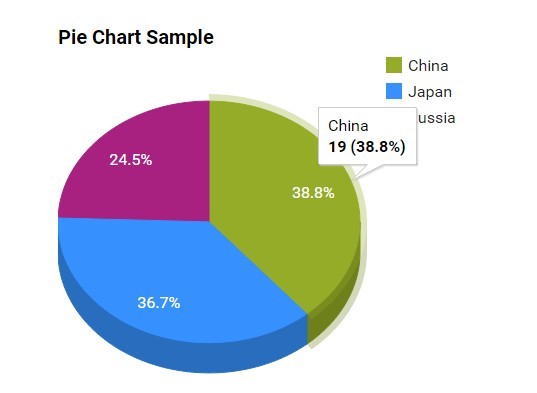
// AreaChart, LineChart, ColumnChart, BarChart or PieChart
chartType: 'ColumnChart',
gvSettings: {
// Settings
vAxis: {title: 'No of players'},
hAxis: {title: 'Month'},
width: 720,
height: 300,
}
});
});
This awesome jQuery plugin is developed by ivellios. For more Advanced Usages, please check the demo page or visit the official website.