jQuery Plugin To Render A Bar Chart From A Table - Table Barchart
| File Size: | 14 KB |
|---|---|
| Views Total: | 8928 |
| Last Update: | |
| Publish Date: | |
| Official Website: | Go to website |
| License: | MIT |
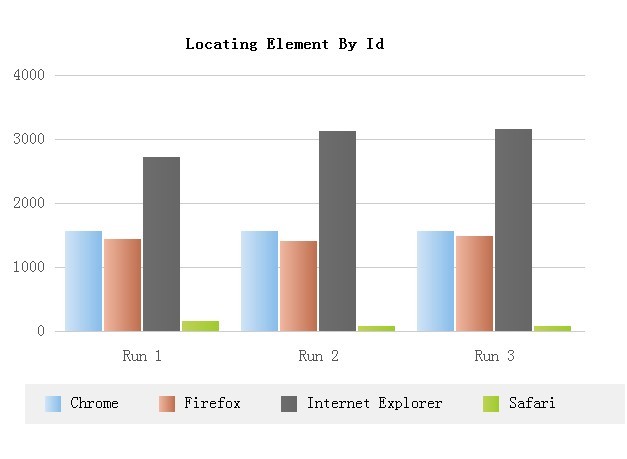
Table Barchart is a lightweight and easy-to-use jQuery plugin used to generate an animated bar chart by reading tabulated data.
See also:
How to use it:
1. Load the jQuery table barchart plugin after jQuery library.
<script src="http://ajax.googleapis.com/ajax/libs/jquery/1.11.1/jquery.min.js"></script>
<script src="TableBarChart.js"></script>
<link rel="stylesheet" href="../TableBarChart.css">
2. Create a source table with sample data in the web page.
<table id="source">
  <caption>
  Bar chart title
  </caption>
  <thead>
    <tr>
      <th></th>
      <th>Run 1</th>
      <th>Run 2</th>
      <th>Run 3</th>
    </tr>
  </thead>
  <tbody>
    <tr>
      <th>Chrome</th>
      <td>1595</td>
      <td>1578</td>
      <td>1584</td>
    </tr>
    <tr>
      <th>Firefox</th>
      <td>1470</td>
      <td>1430</td>
      <td>1500</td>
    </tr>
    <tr>
      <th>Internet Explorer</th>
      <td>2750</td>
      <td>3140</td>
      <td>3162</td>
    </tr>
  </tbody>
</table>
3. Create an empty container and the plugin will render a bar chart into it.
<div id="target">
</div>
4. Initialize the plugin on document ready.
$(function() {

//$('#source').tableBarChart(targetDiv, caption, reverseGroup);
$('#source').tableBarChart('#target', '', false);

});
This awesome jQuery plugin is developed by hnvcam. For more Advanced Usages, please check the demo page or visit the official website.


