Simple Radar Chart Plugin with jQuery and Canvas - Radar Plus
| File Size: | 6.18 KB |
|---|---|
| Views Total: | 7357 |
| Last Update: | |
| Publish Date: | |
| Official Website: | Go to website |
| License: | MIT |
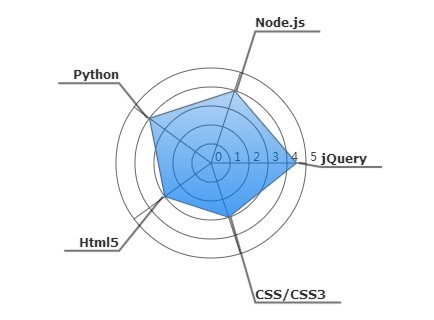
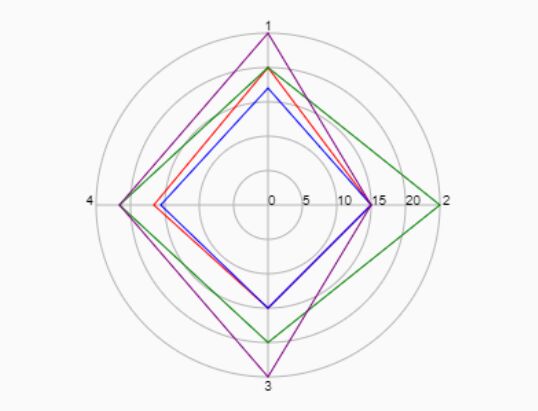
Radar Plus is a lightweight jQuery plugin helps you draw a polygonal graph (radar chart) on circles using Html5 canvas element.
How to use it:
1. Load the latest version of jQuery library and the jQuery radar plus plugin at the end of the document.
<script src="//ajax.googleapis.com/ajax/libs/jquery/1.11.1/jquery.min.js"></script>
<script src="js/jquery-radar-plus.js"></script>
2. Create an empty DIV element to place the radar chart.
<div class="chartCanvasWrap"></div>
3 Put the DIV element inside a wrapper element and define the data for your radar chart either using the data-* attributes or using JavaScript.
<div class="skillsPieChart"
  data-values='{"jQuery": 4.5,"CSS/CSS3": 3.0,"Html5":3.0,"Python":4.0,"Node.js":4.0}'
  data-width="300"
  data-height="300"
  data-red="0"
  data-green="128"
  data-blue="255">

  <div class="chartCanvasWrap"></div>

</div>
4. Initialize the plugin with options.
$(document).ready(function() {

$('.skillsPieChart').radarChart({
size: [380, 300],
step: 1,
fixedMaxValue:5,
showAxisLabels: true
});

});
This awesome jQuery plugin is developed by MehdiTAZI. For more Advanced Usages, please check the demo page or visit the official website.