Dynamic Customizable Radar Chart In JavaScript - jQuery radarGraph.js
| File Size: | 7.07 KB |
|---|---|
| Views Total: | 2217 |
| Last Update: | |
| Publish Date: | |
| Official Website: | Go to website |
| License: | MIT |
radarGraph.js is a small jQuery plugin which dynamically renders a customizable, canvas-based radar chart (radar graph, radar diagram) with legends from JavaScript objects.
How to use it:
1. Put the latest version of the jQuery radarGraph plugin after jQuery slim build.
<script src="https://code.jquery.com/jquery-3.4.1.slim.min.js"
        integrity="sha384-J6qa4849blE2+poT4WnyKhv5vZF5SrPo0iEjwBvKU7imGFAV0wwj1yYfoRSJoZ+n"
        crossorigin="anonymous">
</script>
<script src="radarGraph.min.js"></script>
2. Create an empty canvas element on which you want to draw the radar chart.
<canvas id="example" width="300" height="300"></canvas>
3. Call the function on the canvas element and override the default chart data.
$(function(){
$('#example').radarGraph({
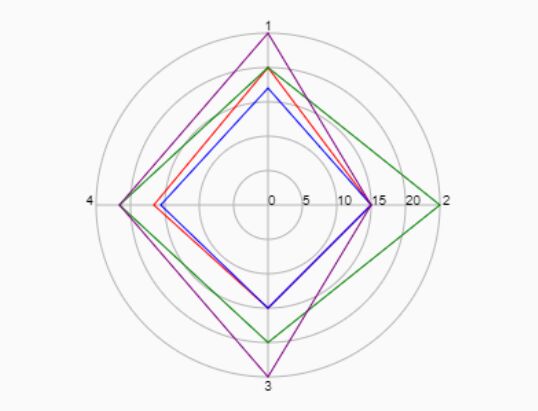
labels: [
'data point1',
'data point2',
'data point3',
'data point4',
],
chartData: {
// color accepts hex value also : #666666
'0':{'name':'thing1','score':[20,15,15,16.6], 'color':'red'},
'1':{'name':'thing2','score':[17,15,15,15.6], 'color':'blue'},
'2':{'name':'thing3','score':[20,25,20,21.6], 'color':'green'},
'3':{'name':'thing4','score':[25,15,25,21.6], 'color':'purple'},
},
});
});
4. Customize the number of lines and rings to draw on the radar chart.
$('#example').radarGraph({
  dataPoints: 4,
  levels: 5
});
5. Set the maximum score. Default: 25.
$('#example').radarGraph({
  maxValue: 30
});
6. Customize the ring color.
$('#example').radarGraph({
  levelColor: '#b5b5b5'
});
7. Customize the padding of the radar chart. Default: 25.
$('#example').radarGraph({
  borderOffset: 10
});
This awesome jQuery plugin is developed by modnar1226. For more Advanced Usages, please check the demo page or visit the official website.