jQuery & Canvas Based Polygon Graph Plugin - Polygonal Graph
| File Size: | 6.88 KB |
|---|---|
| Views Total: | 2651 |
| Last Update: | |
| Publish Date: | |
| Official Website: | Go to website |
| License: | MIT |
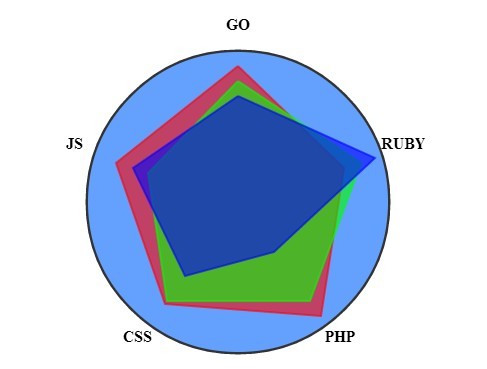
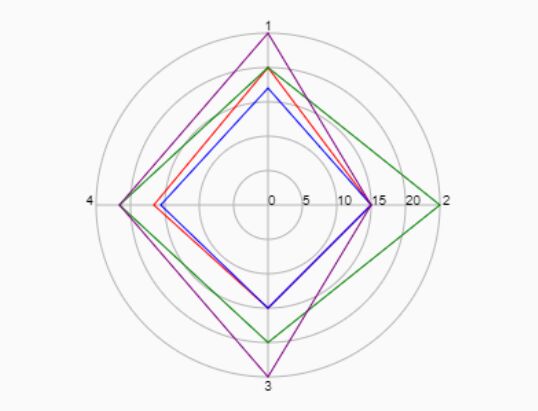
polygonal Graph is a jQuery & jQuery UI based widget used to render a simple polygon graph (radar chart) in an Html5 canvas element.
How to use it:
1. Load the jQuery library & jQuery UI in your document.
<script src="http://ajax.googleapis.com/ajax/libs/jquery/1.11.1/jquery.min.js"></script>
<script src="http://ajax.googleapis.com/ajax/libs/jqueryui/1.10.4/jquery-ui.min.js"></script>
2. Load the jQuery polygonal graph plugin after jQuery Javascript library.
<script type="text/javascript" src="polygonalGraphWidget.js"></script>
3. Create an Html5 canvas element to place the polygon graph.
<canvas id="myCanvas" width="300" height="300"></canvas>
4. Initialize the plugin to draw a polygon graph with custom data set in the JS object arrary.
var labels = new Array('GO', 'JS', 'CSS', 'PHP', 'RUBY');
var data1= new Array(90, 85, 83, 93, 73);
var data2 = new Array(80, 63, 80, 80, 85);
var data3 = new Array(70, 73, 60, 40, 95);
var data = new Array(data1, data2, data3);
var myVar = $("#myCanvas").polygonalGraphWidget({
  labels: labels,
  data: data
});
5. Default options available.
textFont: "bold 16px Times New Roman",
textColor: "#000",
circleLineWidth: 5,
circleRadius: 150,
circleLineColor: "#333",
circleBackgroundColor: "rgba(100, 161, 265, 1)",
graph_colors: [
    "rgba(255, 0, 0, 0.6)",
    "rgba(0, 255, 0, 0.6)",
    "rgba(0, 0, 255, 0.6)"
],
max_val: 99,
phase_start: (Math.PI / 2),
margin: 15,
grid: false,
labels: [],
data: []
This awesome jQuery plugin is developed by revilkent. For more Advanced Usages, please check the demo page or visit the official website.