jQuery Plugin To Create An Animated Canvas Graph - Codex Graph
| File Size: | 4.58 KB |
|---|---|
| Views Total: | 5150 |
| Last Update: | |
| Publish Date: | |
| Official Website: | Go to website |
| License: | MIT |

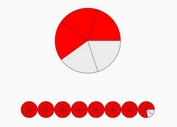
Codex Graph is a lightweight jQuery plugin used to create an animated knob-like graph from a list of items with Html5 data-pamt attributes. Based on Html5 canvas tag, no png or jpg required.
See also:
How to use it:
1. Include jQuery Javacript library and the jQuery codex graph plugin at the bottom of the document.
<script src="//ajax.googleapis.com/ajax/libs/jquery/1.11.1/jquery.min.js"></script>
<script src="js/codexgraph.js"></script>
2. Create an Html canvas element to place the graph.
<canvas id="codex_graph">
</canvas>
3. Insert your data into the graph using Html unordered list with data-pamt attributes.
<ul>
  <li data-pamt='70'>HTML5</li>
  <li data-pamt='90'>jQuery</li>
  <li data-pamt='70'>Javascript</li>
  <li data-pamt='80'>CSS3</li>
  <li data-pamt='20'>Python</li>
  <li data-pamt='20'>Ruby</li>
</ul>
4. Call the plugin on the list to enable the plugin.
$("ul li").codexgraph({
  knobcolor: '#14b9d5',
  fillcolor: '#323a45',
  textcolor: '#FFF',
});
This awesome jQuery plugin is developed by anishtr4. For more Advanced Usages, please check the demo page or visit the official website.
