Simple Canvas Based Line Chart Plugin For jQuery - Topup
| File Size: | 3.28 KB |
|---|---|
| Views Total: | 7252 |
| Last Update: | |
| Publish Date: | |
| Official Website: | Go to website |
| License: | MIT |
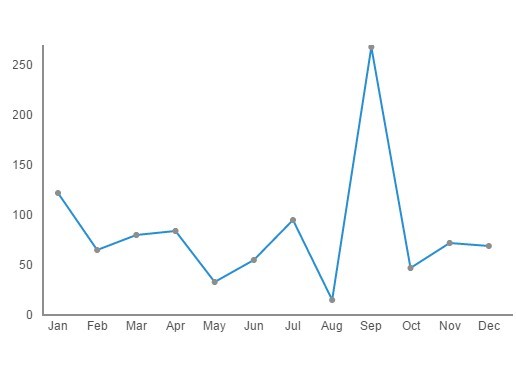
Topup is a lightweight data visualization plugin used to draw a simple, intuitive line chart on the Canvas element. Without the need to write any CSS styles.
How to use it:
1. Include jQuery library and the jQuery topup.js script on your Html page.
<script src="//ajax.googleapis.com/ajax/libs/jquery/2.1.3/jquery.min.js"></script>
<script src="topup.js"></script>
2. Create an Html5 canvas element on the page.
<canvas id="graph"></canvas>
3. Add your dataset & chart options to a JavaScript object as follow.
var chartData = {
    node: "graph",
    dataset: [122, 65, 80, 84, 33, 55, 95, 15, 268, 47, 72, 69],
    labels: ["Jan", "Feb", "Mar", "Apr", "May", "Jun", "Jul", "Aug", "Sep", "Oct", "Nov", "Dec"],
    pathcolor: "#288ed4",
    fillcolor: "#8e8e8e",
    xPadding: 0,
    yPadding: 0,
    ybreakperiod: 50
};
4. Call the function to draw a line chart on the canvas element you just creaded.
drawlineChart(chartData);
This awesome jQuery plugin is developed by kanthvallampati. For more Advanced Usages, please check the demo page or visit the official website.