Easy Pie & Bar Chart Plugin with jQuery and Html5 Canvas - visualize
| File Size: | 11.3 KB |
|---|---|
| Views Total: | 8031 |
| Last Update: | |
| Publish Date: | |
| Official Website: | Go to website |
| License: | MIT |
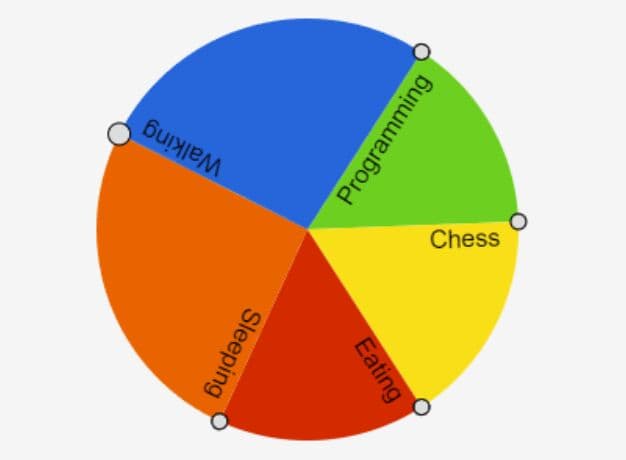
visualize is an easy to use chart jQuery plugin that makes use of javascript and Html5 canvas element to render a simple pie chart or bar chart with random colors on your web page.
How to use it:
1. Include the jQuery javascript and jQuery visualize plugin at the bottom of the web page.
<script src="http://ajax.googleapis.com/ajax/libs/jquery/2.1.0/jquery.min.js"></script>
<script src="visualize.js"></script>
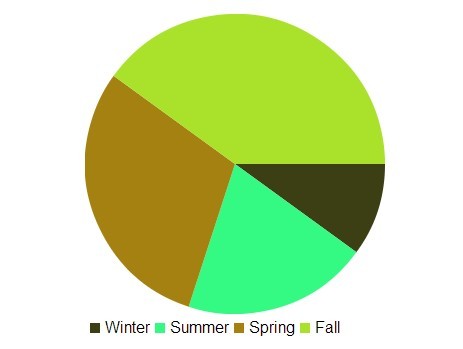
2. The plugin will load data from Html elements with data-value attribute.
<ul class="pie">
<li class="visualize" data-value="1">Winter</li>
<li class="visualize" data-value="2">Summer</li>
<li class="visualize" data-value="3">Spring</li>
<li class="visualize" data-value="4">Fall</li>
</ul>
3. Initialize the plugin and create a simple pie chart with some custom options.
<script>
$(document).ready(function() {
$('.pie').visualize({
width: 300,
height: 300,
type: 'pie', // pie or chart
legend: true
});
});
</script>
Change log:
v0.1.4 (2014-05-01)
- insert html inside canvas for graceful degredation
This awesome jQuery plugin is developed by kellyk. For more Advanced Usages, please check the demo page or visit the official website.