Basic Donut / Ring Chart Plugin with jQuery and Html5
| File Size: | 4.12 KB |
|---|---|
| Views Total: | 6294 |
| Last Update: | |
| Publish Date: | |
| Official Website: | Go to website |
| License: | MIT |

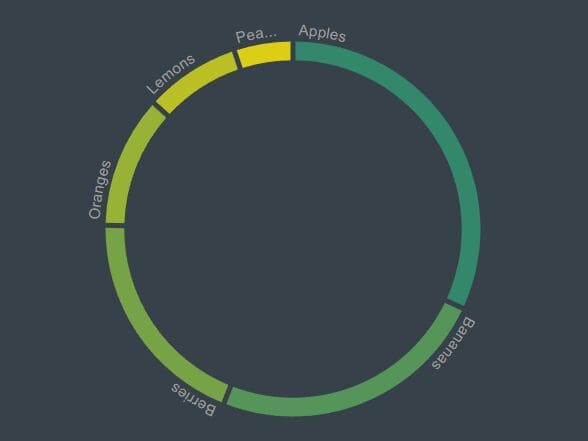
Donut is a very small jQuery plugin that uses Html5 Canvas 2D Context to visualize your data into a doughnut / ring chart.
How to use it:
1. Load the latest version of jQuery library and the jQuery donut plugin in the document.
<script src="//code.jquery.com/jquery-2.1.4.min.js"></script>
<script src="jquery.donut.js"></script>
2. Prepare your data using data-value attribute and wrap them into an Html5 canvas element.
<canvas id="chart" height="300" width="300">
  <div data-value="4">C</div>
  <div data-value="8">C++</div>
  <div data-value="15">Object C</div>
  <div data-value="16">Swift</div>
  <div data-value="23">Ruby</div>
  <div data-value="42">Python</div>
</canvas>
3. Initialize the plugin to render a basic doughnut / ring chart within the parent container.
$('#chart').donut();
4. Customize the color palette for the slices of the chart.
$('#chart').donut({
colors: [
        '#001f3f',
        '#0074d9',
        '#7fdbff',
        '#39cccc',
        '#3d9970',
        '#2ecc40',
        '#01ff70',
        '#ffdc00',
        '#ff851b',
        '#ff4136',
        '#85144b',
        '#f012be',
        '#b10dc9',
        '#111111',
        '#aaaaaa',
        '#dddddd',
    ],
});
This awesome jQuery plugin is developed by ifcanduela. For more Advanced Usages, please check the demo page or visit the official website.