jQuery plugin To Visualize Numeric Data - Bar Indicator
| File Size: | 63.4 KB |
|---|---|
| Views Total: | 5023 |
| Last Update: | |
| Publish Date: | |
| Official Website: | Go to website |
| License: | MIT |
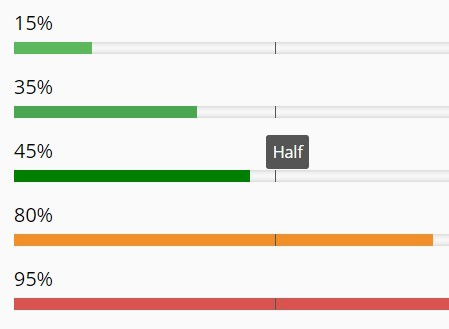
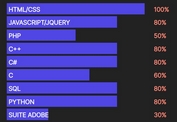
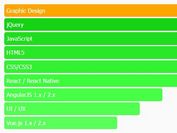
Bar Indicator is a jQuery plugin that enables you to visualize numeric data as percentage or absolute numbers into fully customizable bars, similar to the progress indicator.
Basic usage:
1. Load the jQuery Bar Indicator's stylesheet in the head, and the jquery-barIndicator.js script at the bottom of the webpage.
<link href="barIndicator/css/bi-style.css" rel="stylesheet">
<script src="jquery.min.js"></script>
<script src="barIndicator/jquery-barIndicator.js"></script>
2. Load the jQuery easing plugin for additional easing methods.
<script src="jquery.easing.min.js"></script>
3. Wrap your numeric data into inline elements as follow.
<span id="demo">15</span>
<span id="demo">35</span>
<span id="demo">45</span>
<span id="demo">80</span>
<span id="demo">95</span>
4. Initialize the plugin to draw bar indicators on your web page.
$('#demo').barIndicator();
5. Available options to customize the bar indicator.
wrpClass: 'bi-wrp',
data: false,
style: 'horizontal',
theme: 'bi-default-theme',
animation: true,
animTime: 300,
easing: 'easeOutExpo',
timeout: 0,
colorRange: false,
colorRangeLimits: {
  optimal: '0-40',
  alert: '41-70',
  critical: '71-100'
},
foreColor: false,
backColor: false,
labelColor: false,
labelVisibility: 'default',
labelHoverPos: {
  top:'0',
  left:'20px'
},
vertLabelPos: 'right',
vertLabelAlign: 'middle',
horLabelPos: 'topLeft',
horTitle: false,
numType: 'percent',
lbDecimals: 0,
numMin: 0,
numMax: 100,
numMinLabel: false,
numMaxLabel: false,
numMinLbLeft: false,
numMaxLbRight: false,
numMinLbTop: false,
numMaxLbTop: false,
vertBarWidth: 10,
horBarHeight: 10,
vertBarHeight: 'line',
triggerEvent: 'load',
forceAnim: false,
forceDelay: 100,
labelNumCount: true,
counterStep: 10,
milestones: {
  1: {
    mlPos: 50,
    mlId: false,
    mlClass: 'bi-middle-mlst',
    mlDim: 'inherit',
    mlLabel: 'Half',
    mlLabelVis: 'hover',
    mlHoverRange: 15,
    mlLineWidth: 1
  }
},
avgActive: false,
avgColorIndicator: false,
avgColorBelowAvg: false,
avgColorAboveAvg: false,
avgMlId: false,
avgMlClass: 'bi-average-mlst',
avgMlDim: 'inherit',
avgLabel: 'Average',
avgLabelNum: true,
avgLabelVis: 'hover',
avgLabelHoverRange: 15,
avgLineWidth: 1,
limLabel: true,
limMinLabel: 'min',
limMaxLabel: 'max',
limMinVisible: true,
limMaxVisible: true,
limLabelPos: 'num'
6. Methods.
var bar = $('#bar');
bar.barIndicator();

// execute the loading animation on demand.
bar.barIndicator('reanimateBar');

// load new data on demand.
var newData = 85;
bar.barIndicator('loadNewData', [newData]);

// disable the plugin and remove all of it's data
bar.barIndicator('destroy');

// Call the getPluginData getter and get the barLength property.
var data = bar.barIndicator('getPluginData');
alert(data.barLength);
7. Event.
var bar = $('#bar');
$('#initPluginEventBtn').on('click', function() {
 $(document).on('bi.innerContentAppended', function() {
  //Call any function on event occurrence  });
});
Change log:
2015-06-12
- Fixed load data error
This awesome jQuery plugin is developed by kapantzak. For more Advanced Usages, please check the demo page or visit the official website.
