jQuery/Zepto Plugin For Pretty Line Charts - Pista.js
| File Size: | 12.3 KB |
|---|---|
| Views Total: | 5478 |
| Last Update: | |
| Publish Date: | |
| Official Website: | Go to website |
| License: | MIT |
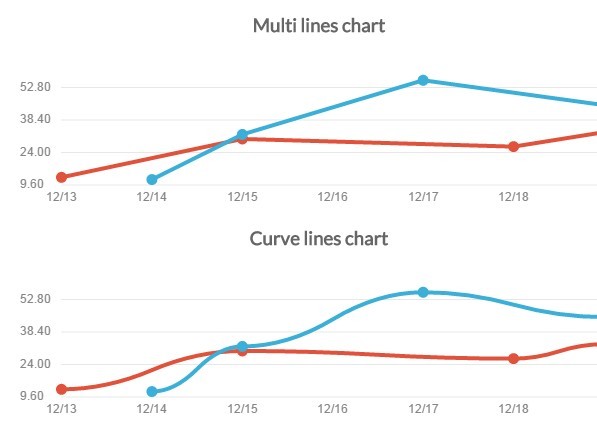
Pista.js is a small yet customizable graph plugin that makes it easy to display your data in a responsive pretty line chart based on canvas element.
Basic usage:
1. Import the latest jQuery library and the jQuery Pista.js script.
<script src="//ajax.googleapis.com/ajax/libs/jquery/1.11.2/jquery.min.js"></script>
<script src="jquery.pista.js"></script>
2. Create a empty container that the plugin will render a line chart within it.
<div id="basic"></div>
3. Prepare your data using data array in the JavaScript.
data= [{ name:"first",
  data:[
    {value:12, date:"12/14/2014"},
    {value:32, date:"12/15/2014"},
    {value:56, date:"12/17/2014"},
    {value:45, date:"12/19/2014"}
    ]
  },{ name:"second",
  data:[
    {value:13, date:"12/13/2014"},
    {value:30, date:"12/15/2014"},
    {value:26.6, date:"12/18/2014"},
    {value:33, date:"12/19/2014"}
    ]
  }
]
4. Add some options to the line chart.
options={
  height: 150,
  width: 600,
}
5. Call the plugin and render a basic line chart.
$("#basic").pista(data, options);
6. Full plugin options.
height: 100,
width: 100,
x:{
  margin: 15,
  min: null,
  max:null
},
y:{
  margin:0.2,
  min:null,
  max:null
},
goal: {
  show:false,
  value:23,
  color: mainColor
},
tooltip: {
  how:true,
  maxRadius: 3
},
lines: {
  show: true,
  fill: false,
  curve:false,
  strokeColor: [mainColor, secondaryColor],
  strokeWidth: 4,
  fillOpacity: 0.4,
  fillColor:[mainColor, secondaryColor]
},
points:{
  show: true,
  strokeWidth:3.5,
  strokeColor:[mainColor, secondaryColor]
},
labels:{
  lineWidth: 0.3,
  fontSize: 11,
  x:{
    number: 7,
    show:true,
    color:"#858585",
    grid:false },
  y:{
    number:4,
    show:true,
    color:"#858585",
    grid:true
 }}
};
This awesome jQuery plugin is developed by urcoilbisurco. For more Advanced Usages, please check the demo page or visit the official website.