Create A Tone Curve UI Component In jQuery - iocurve
| File Size: | 523 KB |
|---|---|
| Views Total: | 1231 |
| Last Update: | |
| Publish Date: | |
| Official Website: | Go to website |
| License: | MIT |
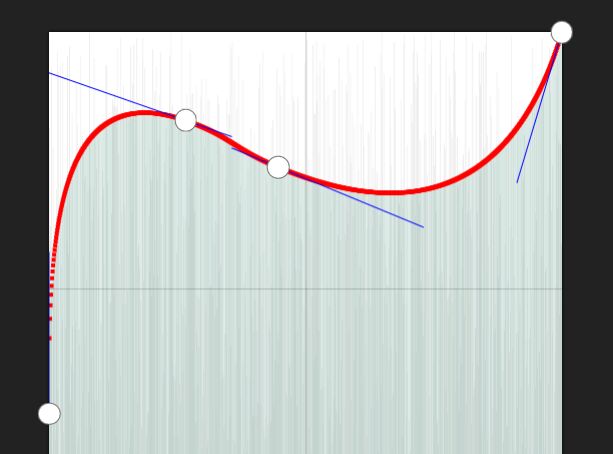
iocurve is a fully configurable jQuery plugin to create a Photoshop and Lightroom inspired Tone Curve UI where you can adjust points throughout a given value range via mouse drag.
More Features:
- Custom curvature.
- Custom grid style.
- Bar (column) chart.
- Custom plot diagram.
- Custom histogram.
- Custom connection line.
How to use it:
1. Create a container to hold the Tone Curve UI.
<div class="iocurve"></div>
2. Download the zip and load the minified version of the iocurve plugin after loading jQuery library.
<script src="/path/to/cdn/jquery.min.js"></script>
<script src="/path/to/dist/jquery.iocurve.min.js"></script>
3. Call the function on the container element to generate a basic Tone Curve UI.
$(function(){
  $('.iocurve').iocurve();
});
4. Customize the Tone Curve UI. All possible default options:
$('.iocurve').iocurve({

  // input/output value range
  x: [0, 255],
  y: [0, 255],

  // decomposition width
  dx: 1,

  // Y axis
  y0: 0,

  // curvature
  curvature: 0.3,

  // CSS class
  className: '',

  // CSS styles
  css: {
    position: 'relative',
    margin: '20px'
  },

  // canvas styles
  canvas: {
    height: '100%',
    css: {
      display: 'block',
      boxShadow: '0 0 3px #000'
    },
    fillStyle: '#fff'
  },

  // grid options
  grid: {
    visible: true,
    strokeStyle: 'rgba(0, 0, 0, 0.2)'
  },

  // anchor options
  anchor: {
    points: [ [0, 0], [255, 255] ],
    tagName: 'a',
    className: 'anchor',
    css: {
      position: 'absolute',
      display: 'block',
      width: 18,
      height: 18,
      borderRadius: '50%',
      border: '1px solid rgba(0, 0, 0, 0.5)',
      background: '#fff',
      boxSizing: 'border-box',
      cursor: 'move',
      transform: 'translate(-50%, -50%)'
    }
  },

  // bar styles
  bar: {
    visible: true,
    fillStyle: {
      positive: 'rgba(0, 100, 70, 0.2)',
      negative: 'rgba(150, 30, 70, 0.2)'
    }
  },

  // plot diagram styles
  plot: {
    visible: false,
    strokeStyle: '#f00'
  },

  // histogram styles
  histogram: {
    data: null,
    fillStyle: '#ddd'
  },

  // connection line styles
  controlPoint: {
    visible: false,
    strokeStyle: '#00f'
  }

});
5. Event handlers.
var $curve = $('.iocurve').iocurve(option);

$curve.on('anchor', function(ev, anchor){
  // anchor.element   anchor DOM element
  // anchor.kind      'new'|'move'|'remove'
  // anchor.x         coordinate X
  // anchor.y         coordinate Y
});

$curve.on('output', function(ev, data){
  console.log(data);
});

$curve.on('anchors', function( ev, $anchors ){
  // $anchors is jQuery object of all anchor elements.
  // Caution: Do not modify $anchors. It is read-only. Because it is a managed object inside the plugin.
  $anchors.each(function() {
      // $(this) is one anchor.
  });
});
6. API methods.
$curve.trigger('data', [function( data ){
  // get data
}]);

$curve.trigger('option', [{
  // update options
}]);

// resize to fit the parent element.
$curve.trigger('resized');

// destroy the instance
$curve.trigger('destroy');
Changelog:
2021-12-04
- v0.6.0: Anchor points in event calls
2020-08-30
- v0.5.0
2020-08-24
- Adjusted options
- Updaed demos.
2020-08-23
- Added events
This awesome jQuery plugin is developed by cmiz. For more Advanced Usages, please check the demo page or visit the official website.


