Simple Canvas Line Chart Plugin For jQuery and jQuery UI - Chart2
| File Size: | 107 KB |
|---|---|
| Views Total: | 2526 |
| Last Update: | |
| Publish Date: | |
| Official Website: | Go to website |
| License: | MIT |
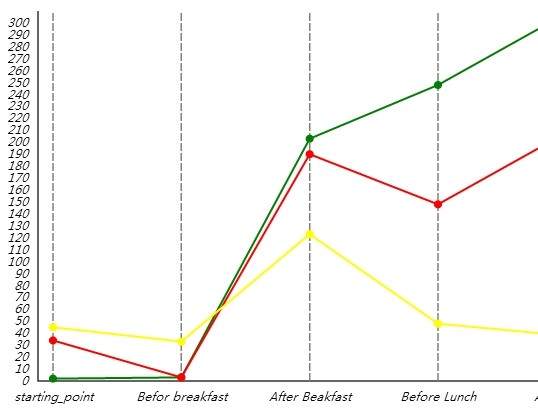
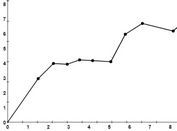
Chart2 is a very simple chart plugin built on top of jQuery, jQuery UI and Html5 canvas to draw a line chart & graph by loading data from Javascript array objects.
Basic Usage:
1. Load the required jQuery library and jQuery UI in the Html document.
<script src="http://ajax.googleapis.com/ajax/libs/jquery/1.11.0/jquery.min.js"></script>
<script type="text/javascript" src="http://code.jquery.com/ui/1.10.4/jquery-ui.min.js"></script>
2. Make sure to load the jQuery chart2 plugin after jQuery library.
<script src="jquery.chart2.js"></script>
3. Create a container element you want to render a line chart within it.
<div id="chart">

</div>
4. Create a dataset for the line chart following the data format like this.
var datas = [
{
style: {stroke: 'green', fill: '#fff'},
values: [
{ x: 'starting_point', y: 2},
{ x: 'Befor breakfast', y: 3 },
{ x: 'After Beakfast', y: 203 },
{ x: 'Before Lunch', y: 248 },
{ x: 'After Lunch', y: 308},
{ x: 'Afternoo', y: 234},
]
},
{
style: {stroke: 'red', fill: '#fff'},
values: [
{ x: 'starting_point', y: 34},
{ x: 'Befor breakfast', y: 3},
{ x: 'After Beakfast', y: 190},
{ x: 'Before Lunch', y: 148},
{ x: 'After Lunch', y: 208},
{ x: 'Afternoo', y: 234},
]
},
{
style: {stroke: 'yellow', fill: '#fff'},
values: [
{ x: 'starting_point', y: 45},
{ x: 'Befor breakfast', y: 33},
{ x: 'After Beakfast', y: 123},
{ x: 'Before Lunch', y: 48},
{ x: 'After Lunch', y: 38},
{ x: 'Afternoo', y: 44},
]
}
];
5. Initialize the line chart by calling the function on the empty container element.
$('#chart').chart2({
data: datas
});
6. Available options.
$('#chart').chart2({
xPadding: 30,
yPadding: 30,
chartHeight: 400,
chartWidth: 800,
data: [],
renderPoints: true
});
This awesome jQuery plugin is developed by JannyK. For more Advanced Usages, please check the demo page or visit the official website.
