Minimal Animated jQuery Data Visualization Plugin - Dataviz
| File Size: | 3.77 KB |
|---|---|
| Views Total: | 3402 |
| Last Update: | |
| Publish Date: | |
| Official Website: | Go to website |
| License: | MIT |
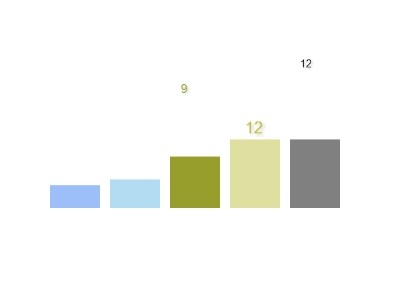
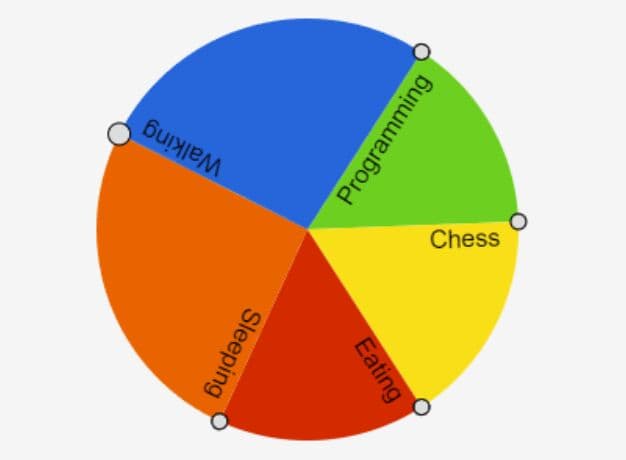
Dataviz is a simple lightweight jQuery & canvas based data visualization plugin that draws a pie chart or bar chart from a dataset defined in Html elements.
How to use it:
1. Load the jQuery javascript library and the jQuery dataviz plugin in the Html page.
<script src="http://ajax.googleapis.com/ajax/libs/jquery/1.11.1/jquery.min.js"></script>
<script type="text/javascript" src="jquery.dataviz.js"></script>
2. Create an Html element that will be serve as a chart container.
<div id="graph_wrapper"></div>
3. Build a dataset in the form inputs.
<form action="" method="post">
<input type="text" pattern="[0-9]*" name="val1" value="4" placeholder="placeholder1"><br>
<input type="text" pattern="[0-9]*" name="val2" value="5" placeholder="placeholder2"><br>
<input type="text" pattern="[0-9]*" name="val3" value="9" placeholder="placeholder3"><br>
<input type="text" pattern="[0-9]*" name="val4" value="12" placeholder="placeholder4"><br>
<input type="submit" name="submit" value="Generate">
</form>
4. Generate a bar chart (or pie chart) in the graph container you just created.
<script type="text/javascript">
jQuery(document).ready(function($) {
$('form').submit(function(e){
e.preventDefault();
var values = [];
$(this).find('input[type=text]').each(function(index){
val = ($(this).val()> 0) ? $(this).val() : 0;
values.push(parseFloat(val));
});
$('#graph_wrapper').DataViz({'values': values }).data('DataViz').draw_pie();
// or $('#graph_wrapper').DataViz({'values': values }).data('DataViz').draw_bar();
});
});
</script>
This awesome jQuery plugin is developed by arpadcseh. For more Advanced Usages, please check the demo page or visit the official website.