jQuery Chart & Graph Plugins
Download Free jQuery Pie Chart, Bar Chart, Donut Chart, Line Chart and other data visualization tools & plugins at our jQuery Chart & Graph Section. Page 7 .
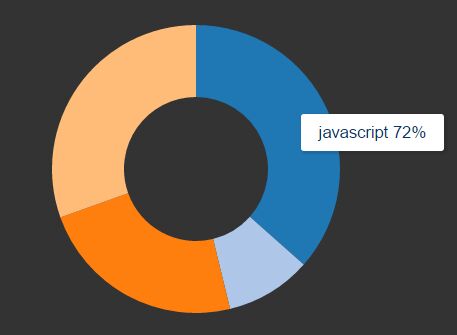
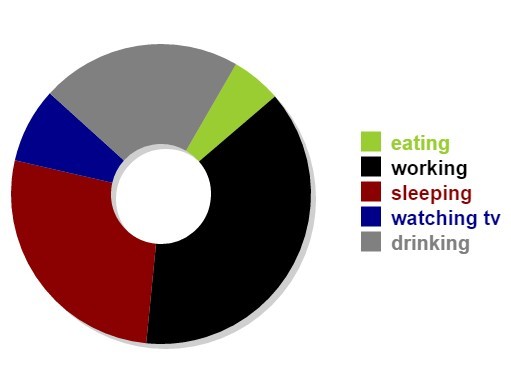
Dynamic Donut / Pie Chart Plugin with jQuery And D3.js - donut-pie-chart.js
- Chart & Graph - 13925 Viewsdonut-pie-chart.js is a very small jQuery plugin that lets you render dynamic, animated, SVG-based donut / pie charts using d3.js library.
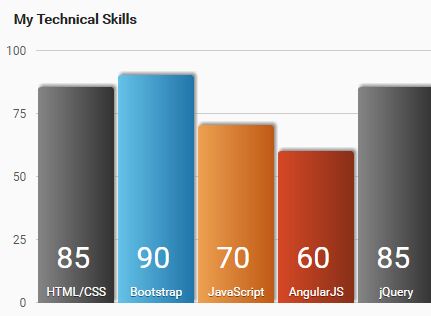
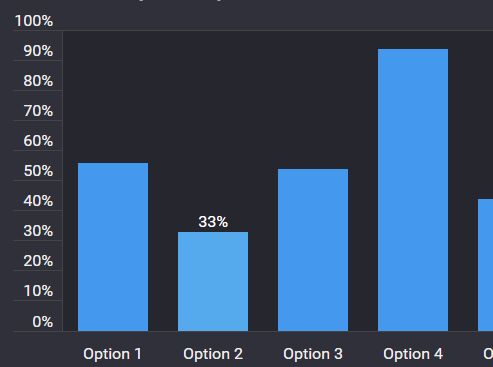
HTML Table Based Column Chart Plugin For jQuery - graph.js
- Chart & Graph - 14006 Viewsgraph.js is a tiny and easy-to-use jQuery plugin that converts a data table into an animated column/bar chart with custom legends and percentage values.
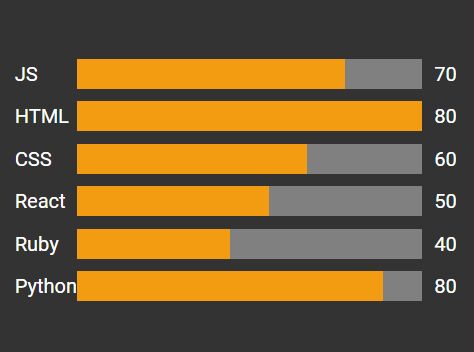
Simple Plain Bar Chart Plugin With jQuery - barCharts
- Chart & Graph - 9850 ViewsbarCharts is a very small jQuery plugin used to render an animated, horizontal or vertical bar chart / progress bar using plain HTML and CSS.
Simple Canvas Based Donut Chart Plugin With jQuery - Sweet Donut
- Chart & Graph - 6046 ViewsSweet Donut is a simple jQuery plugin which renders a pretty nice doughnut chart on an HTML5 canvas element to present an array of numeric values.
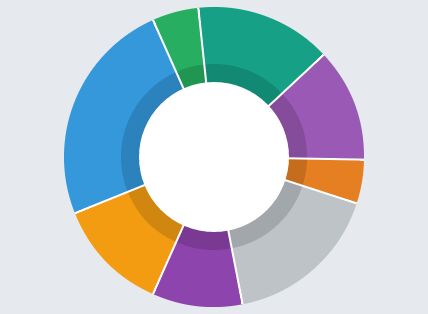
Vector Shaped Doughnut Chart Plugin With jQuery - svgDoughnutChart.js
- Chart & Graph - 6180 ViewssvgDoughnutChart.js is a really simple jQuery charting plugin which makes use of SVG to plot your data as customizable, vector shaped doughnut graphs.
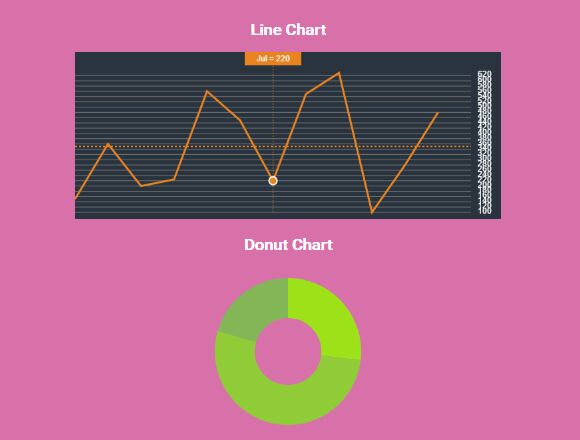
Responsive HTML5 Line & Donut Chart Plugin With jQuery - KlondikeChart
- Chart & Graph - 3618 ViewsKlondikeChart is a lightweight charting plugin for jQuery that makes it easy to represent your data in responsive, customizable, html5 canvas based line and/or donut charts.
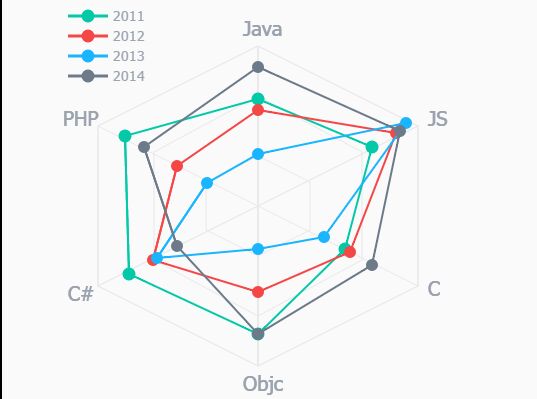
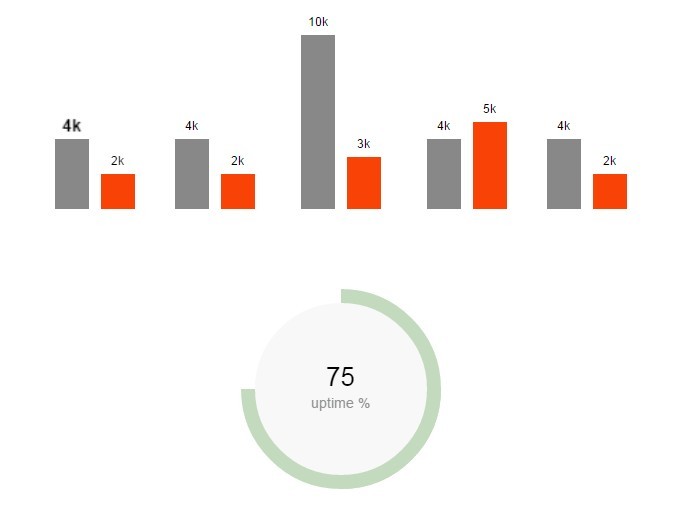
Tiny & High Performance Charting Library For jQuery - Graphart
- Chart & Graph - 2224 ViewsGraphart is a lightweight and high performance charting library for jQuery that makes uses of HTML5 canvas to draw animated, flat style charts & graphs.
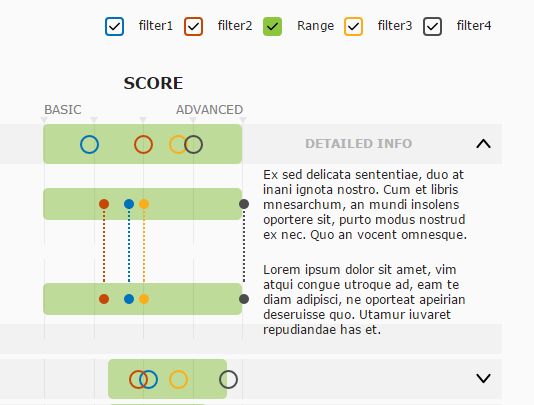
Creating Nested Range Line Chart With jQuery - lineRangeChart
- Chart & Graph - 1359 ViewslineRangeChart is a jQuery plugin which allows to visualize your complex data in a responsive range & line chart with custom filters and ranges.
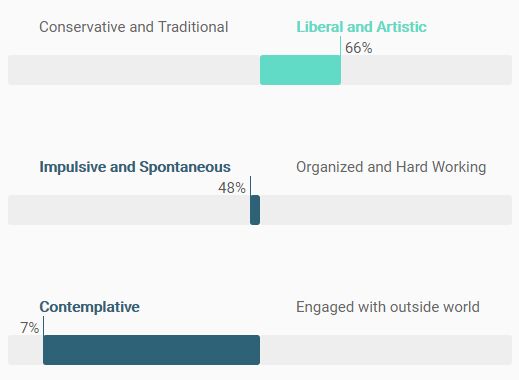
Animated Bipolar Bar Chart Plugin With jQuery - cssbipolarchart
- Chart & Graph - 1848 Viewscssbipolarchart is a jQuery plugin which uses plain HTML5 and CSS to draw animated bipolar dual-Y bar charts on the webpage.
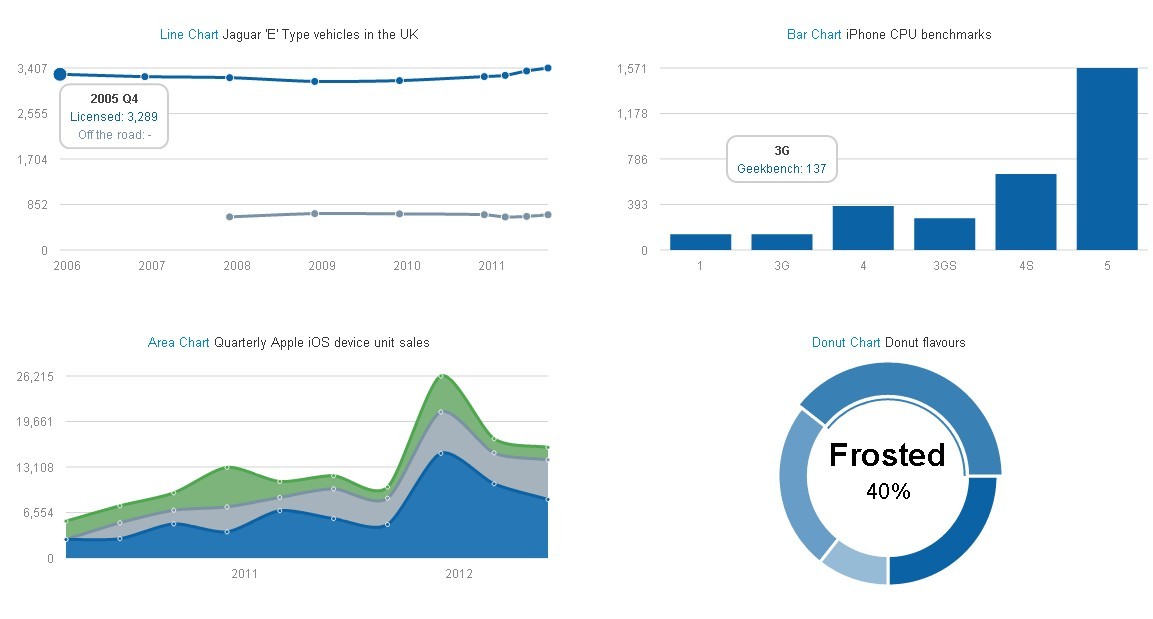
Morris - Good-looking Charts Plugin With jQuery
- Chart & Graph - 57778 ViewsMorris is a Good-looking Chats Plugin with jQuery and Raphaël JS Library to make drawing simple charts easy. It also works fine on mobile device such as iOS and android.
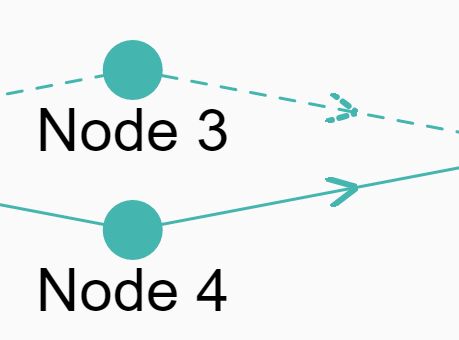
SVG Based Workflow Diagram Plugin With jQuery - workflowChart.js
- Chart & Graph - 13329 ViewsworkflowChart.js is a simple, lightweight jQuery plugin which uses svg.js to draw a SVG based workflow diagram to visualize how tasks will flow between nodes.
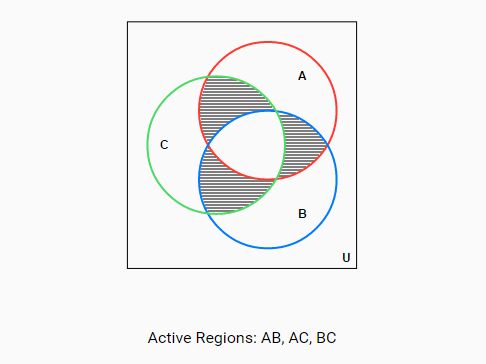
SVG Based Venn Diagram Plugin With jQuery - Venn
- Chart & Graph - 2502 ViewsVenn is a jQuery plugin which helps you render a simple, interactive, vector shaped Venn diagram to represent all possible logical relations between different sets.
Minimalist Bar Chart Plugin With jQuery And CSS - barChart
- Chart & Graph - 7544 ViewsbarChart is a minimalist jQuery script which helps you render a basic, animated bar / column chart from plain html lists to present your percentage values.
jQuery Plugin To Convert Tabular Data Into Donut Charts - Chart.js
- Chart & Graph - 9607 ViewsChart.js is a lightweight jQuery plugin used to render an HTML5 canvas based doughnut chart to present tabular data with chart legends and labels support.
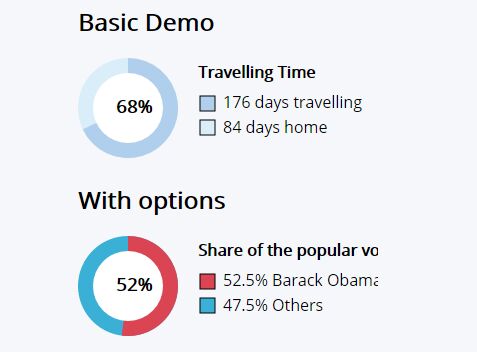
Lightweight Chart Plugin With jQuery and CSS - cssCharts.js
- Chart & Graph - 16550 ViewscssCharts.js is a simple lightweight jQuery chart plugin which uses plain Html5/CSS to plot data as charts, donuts or lines.
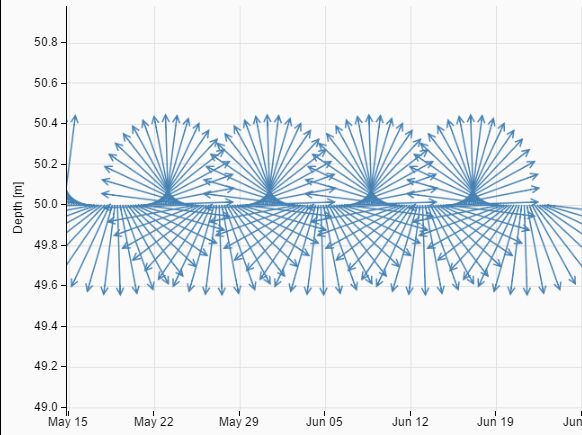
Canvas Based Plotting Plugin With jQuery And D3.js - CanvasPlot
- Chart & Graph - 1276 ViewsCanvasPlot is a powerful, interactive JavaScript plotting library which allows to visualize your large data sets using jQuery, D3.js and Html5 canvas element.
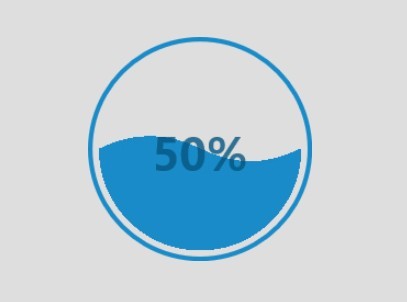
Customizable Liquid Bubble Chart With jQuery and Canvas
- Chart & Graph - 19902 ViewsA super tiny yet customizable jQuery plugin used to present your numeric data in a Canvas liquid bubble chart with a water fill animation.
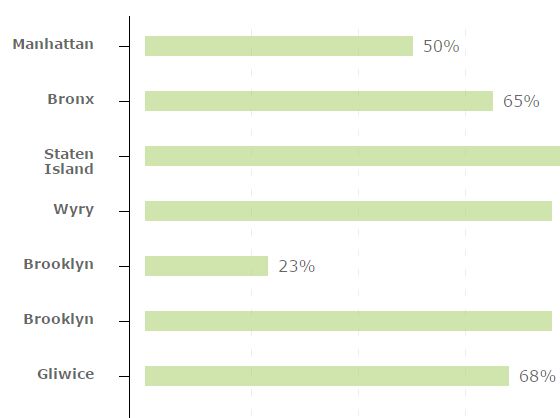
Basic Horizontal Bar Chart Plugin For jQuery - rumcaJS
- Chart & Graph - 8428 ViewsrumcaJS is a tiny and easy to customize jQuery plugin used to render a responsive, horizontal and data-driven bar chart on the webpage.
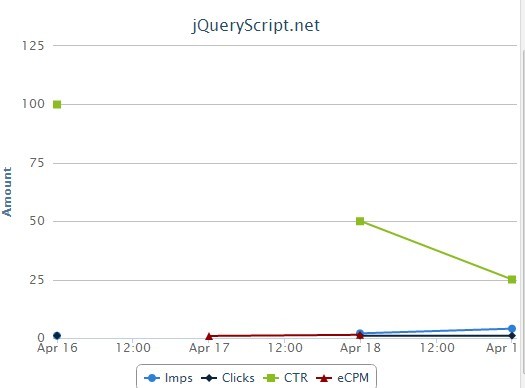
jQuery Plugin To Convert Table To Highcharts Graph - Highcharts Maker
- Chart & Graph - 6128 ViewsHighcharts Maker is a lightweight jQuery plugin used to generate an intuitive, interactive, responsive chart from table data, requires the popular Highcharts.js library.
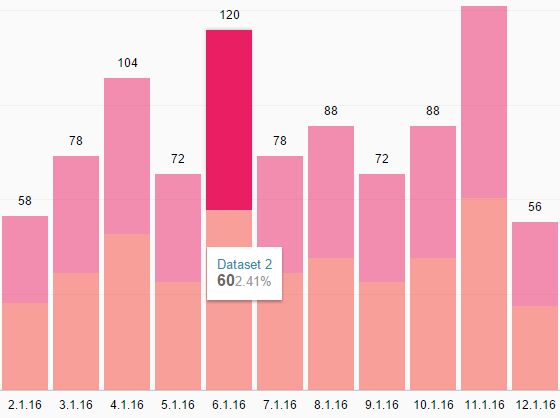
Interactive Stacked Chart Plugin with jQuery and CSS3 - barChart
- Chart & Graph - 9914 ViewsbarChart is a simple jQuery chart plugin that presents multiple datesets in an interactive, customizable, stacked column / bar chart.