jQuery Chart & Graph Plugins
Download Free jQuery Pie Chart, Bar Chart, Donut Chart, Line Chart and other data visualization tools & plugins at our jQuery Chart & Graph Section. Page 5 .
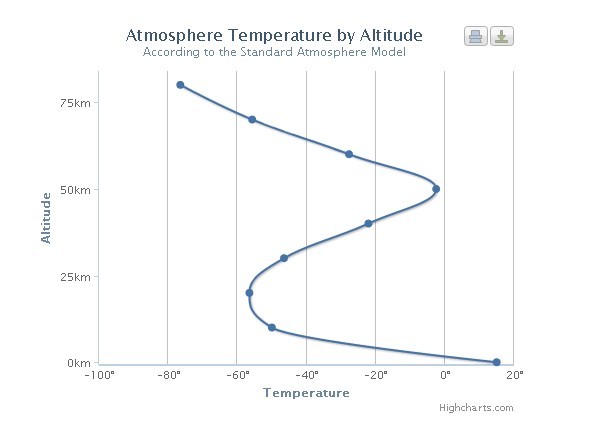
Interactive Charts JS Library - Highcharts
- Chart & Graph - 4676 ViewsHighcharts is a powerful javascript library works with jQuery for adding a variety of interactive charts to your projects or applications.

Visualize Data Using Animated Circles - jQuery Circle.js
- Chart & Graph - 1369 ViewsjQuery Circle.js is a lightweight data visualization plugin which can be used to reveals educational attainment levels using animated circles.
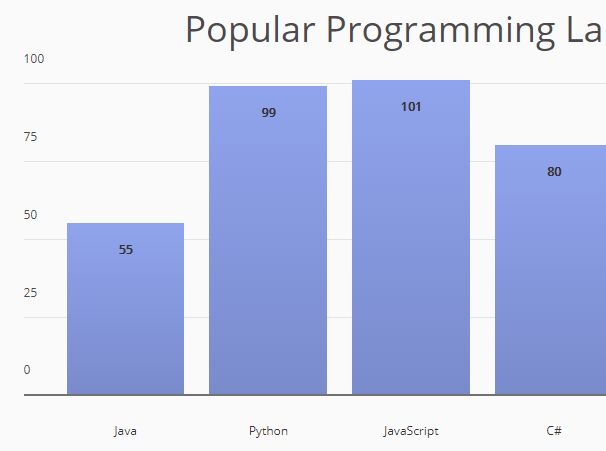
Simple Plain Bar Chart Plugin With jQuery - Graphite.js
- Chart & Graph - 4881 ViewsGraphite.js is a lightweight jQuery plugin to generate a minimal, clean, dynamic, configurable bar/column chart from a data object. With support for x-axis labels and y-axis markers.
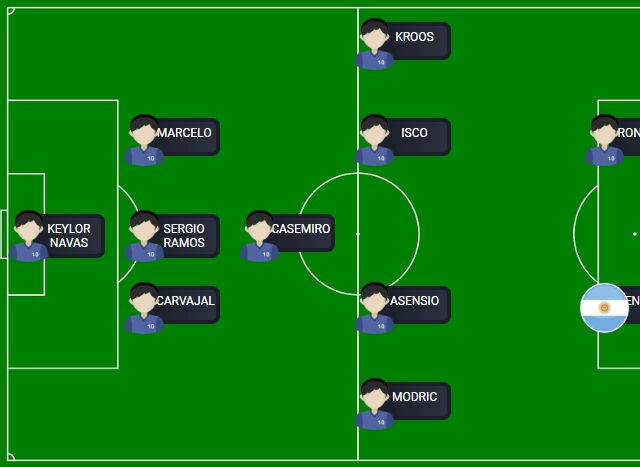
Soccer Field Diagram With Players And Positions - jQuery soccerField.js
- Chart & Graph - 6541 ViewssoccerField.js is a jQuery plugin used to illustrate team formations that dynamically display players and their positions(roles) on a soccer(football) field diagram with lots of configuration options.
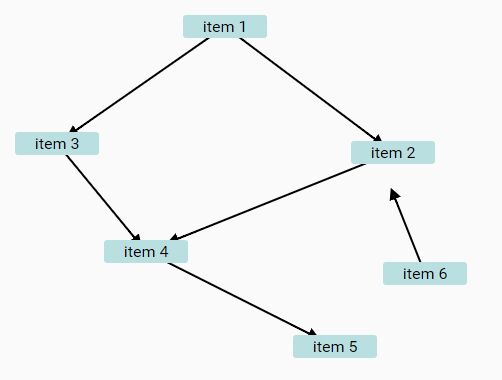
Dynamic Directed Graph Plugin With jQuery And SVG - Arg-Graph
- Chart & Graph - 4269 ViewsArg-Graph is a dynamic jQuery based Directed Graph generator/editor which enables you to draw SVG based connectors (lines, arrows) between DOM nodes via drag and drop.
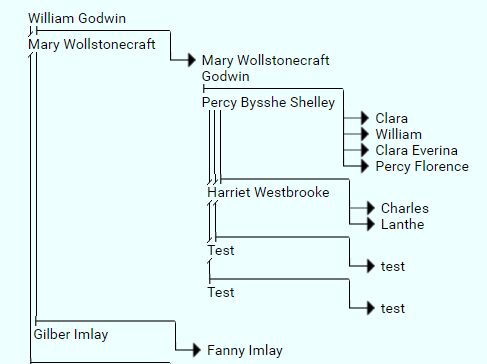
Simple Family Tree Generator With JavaScript - jQuery Tree.js
- Chart & Graph - 15984 ViewsA lightweight, simple and semantic jQuery family tree plugin which helps you to draw complex family tree diagrams from nested HTML unordered lists.
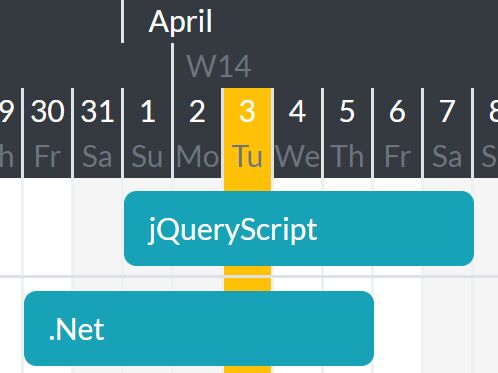
Dynamic Customizable Gantt Chart Plugin - jQuery ganttChart
- Chart & Graph - 10057 ViewsganttChart is an easy-to-use jQuery plugin that lets you create a dynamic, customizable gantt chart to visualize your schedules (activities/tasks/events) in a horizontal, scrollable bar chart.
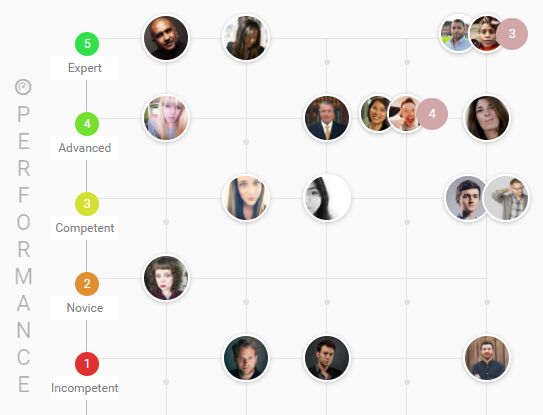
Dynamic Matrix Chart Plugin With jQuery - matrixChart.js
- Chart & Graph - 3996 ViewsmatrixChart.js is a jQuery plugin that helps you generate a dynamic, customizable matrix chart to visualize the relationships between two or more items in grid format.
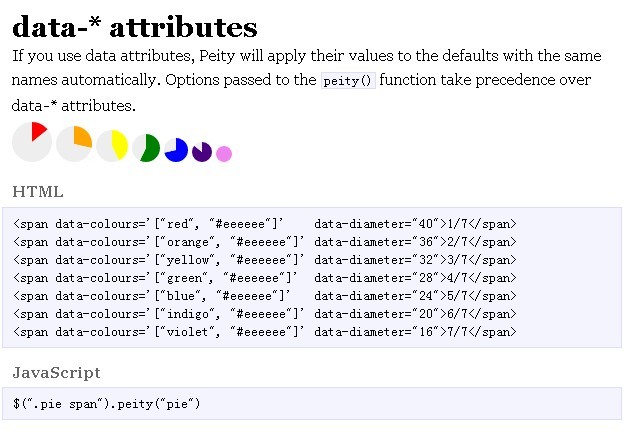
jQuery Plugin for Converting Content into Canvas Element - peity
- Chart & Graph - 5690 Viewspeity is a simple jQuery plugin for converting an element's content into a simple canvas element. You can use this plugin to easily create mini pie, line or bar chart on your web page.
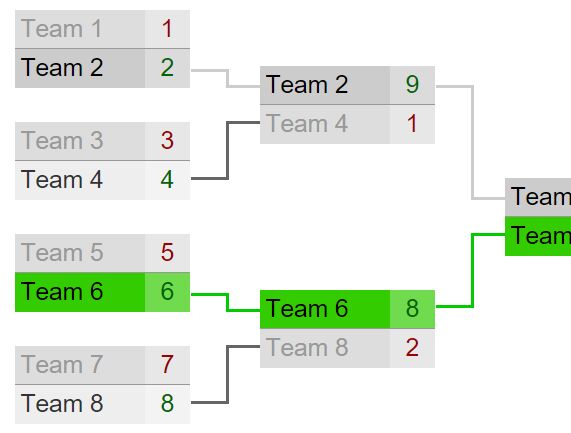
jQuery Plugin For Customizable Tournament Brackets - Bracket
- Chart & Graph - 23402 ViewsJust another jQuery based tournament brackets which allows you to create, organize and manage single and double elimination tournaments.

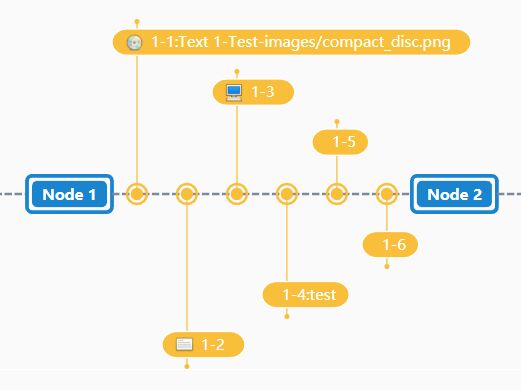
Horizontal Timeline With Milestones - jQuery milestones
- Chart & Graph - 11070 Viewsmilestones a jQuery timeline plugin that uses the Bootstrap progress bar component to generate a horizontal timeline with custom milestones.
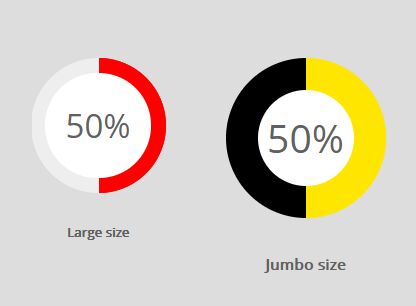
Minimal HTML5 Donut Chart Plugin For jQuery - DonutWidget
- Chart & Graph - 9818 ViewsDonutWidget is a simple plain jQuery plugin to present your data (e.g. progress percentage) in a doughnut/ring chart that is fully configurable via HTML data attributes.
Create Timeline Style Graphs With jQuery And Raphaël - Timeline.js
- Chart & Graph - 9759 ViewsThe Timeline.js jQuery plugin makes use of Raphaël.js library to create complex, cross-browser, timeline-style, vector shaped graphs from nested JSON data.
Basic Line Chart Plugin For jQuery - blueberryCharts.js
- Chart & Graph - 4504 ViewsblueberryCharts.js is a small jQuery plugin which helps you draw dynamic, interactive, pretty nice, multi-series line charts using SVG elements.
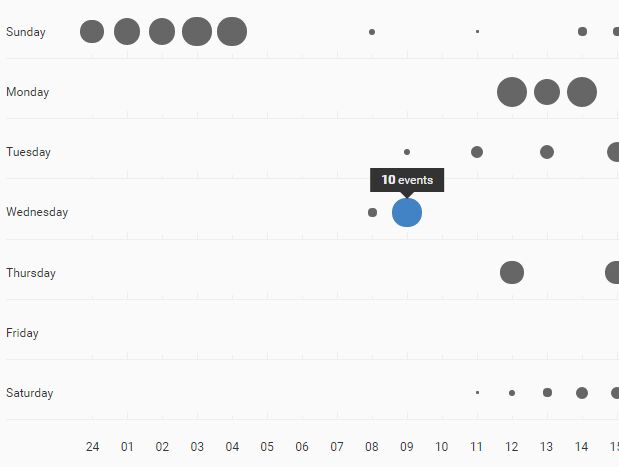
Github Inspired Punchcard Graph Plugin For jQuery - punchcard.js
- Chart & Graph - 1569 Viewspunchcard.js is a jQuery plugin for creating Github-inspired dynamic punchcard graph to visualize the user activity on your web app.
jQuery Plugin To Create Canvas Based Graphical Ratings - Rate
- Chart & Graph - 6654 ViewsRate is a super tiny jQuery rating plugin which dynamically draws box- and ring chart-style graphical ratings using JavaScript, HTML5 canvas and CSS/CSS3.

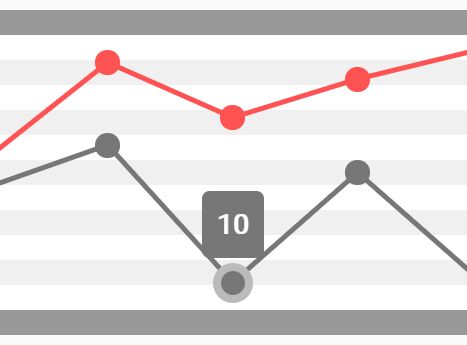
Dynamic Line Chart Plugin With jQuery - scale.js
- Chart & Graph - 3068 Viewsscale.js is a tiny, simple-to-use, AJAX-enabled jQuery data visualization plugin which dynamically renders a line chart on a grid view using plain JavaScript, HTML and CSS.
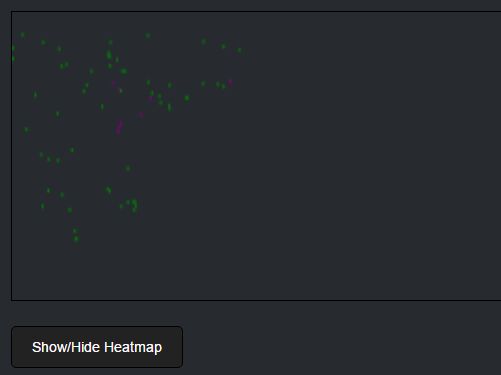
Click Heat Map Generator With jQuery And Canvas - Heatmap.js
- Chart & Graph - 2493 ViewsA jQuery plugin that lets you generate a click heat map on an HTML5 canvas element to visualize where your visitors left or right click on the web content.

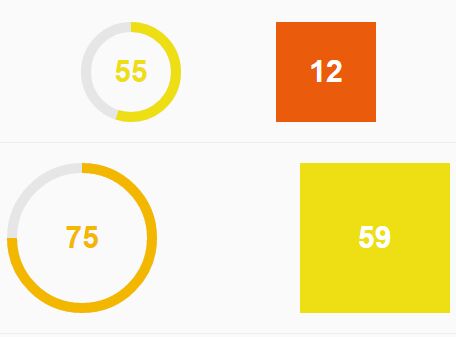
Highly Customizable HTML5 Ring Chart Plugin - circleChart
- Chart & Graph - 4630 ViewscircleChart is a jQuery plugin which helps you draw animated, highly customizable, circle-style ring charts on the HTML5 canvas element.
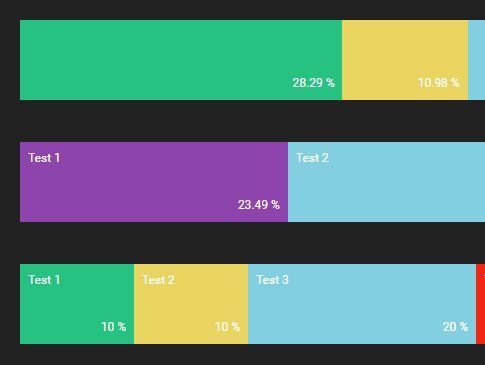
Dynamic Segmented Bar Chart In jQuery - segbar.js
- Chart & Graph - 5227 Viewssegbar.js is a lightweight jQuery plugin that lets you render responsive, dynamic, horizontal Segmented Bar Charts from JSON objects.