jQuery Chart & Graph Plugins
Download Free jQuery Pie Chart, Bar Chart, Donut Chart, Line Chart and other data visualization tools & plugins at our jQuery Chart & Graph Section. Page 2 .

Canvas-based Gantt Chart Plugin - jQuery simpleGantt.js
- Chart & Graph - 2245 ViewsA lightweight and open-source jQuery plugin that helps developers generate simple, customizable, and HTML5 canvas based Gantt Charts on the page.

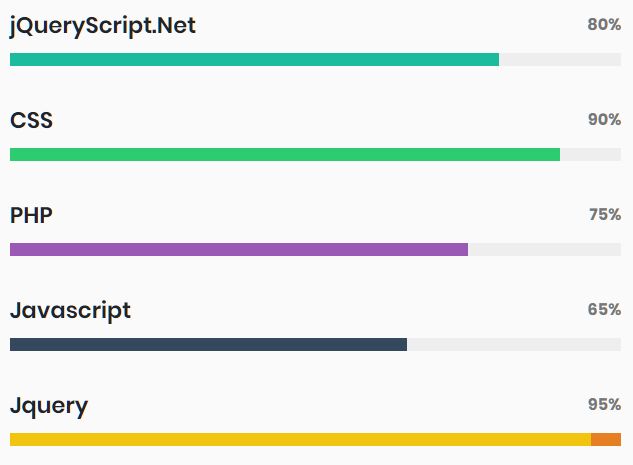
Minimal Animated Horizontal Bar Graph Plugin - jQuery SkillProgress
- Chart & Graph - 1170 ViewsThe SkillProgress jQuery plugin uses animated horizontal progressbars to illustrate your skills, experiences, goals, or anything else you may want to track over time.
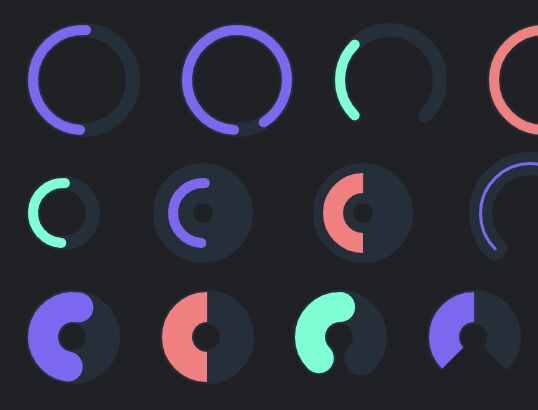
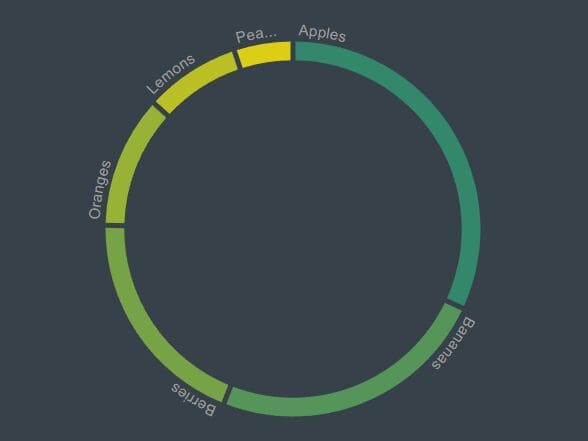
Animated Donut/Pie/Ring Charts With jQuery And SVG - Donutty
- Chart & Graph - 16516 ViewsDonutty is a JavaScript/jQuery charting library which lets you generate smoothly animated, fully scalable Donut/Pie/Ring Charts or Circular/Radial progressbars using SVG and CSS3 animations.

Responsive Customizable Line Chart Generator - jQuery Graphiq
- Chart & Graph - 2693 ViewsA lightweight jQuery plugin that makes it easier to generate responsive, customizable, scalable SVG line charts using plain JavaScript, CSS, and HTML.
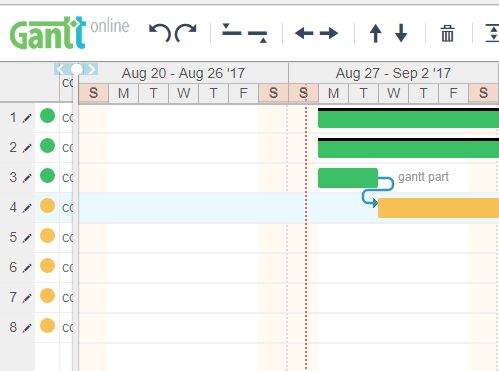
Powerful Gantt Chart Editor With jQuery - jQueryGantt
- Chart & Graph - 24839 ViewsA powerful, customizable jQuery Gantt editor that helps you dynamically create a gantt chart for your flexible project management.

Fraction Visualizer With jQuery And HTML5 Canvas - FractionPainter
- Chart & Graph - 706 ViewsA lightweight jQuery based Fraction Visualizer that draws a picture of the fraction as filled circles, just like a pie chart.

Create An Animated Polyline Timeline with jQuery
- Chart & Graph - 1135 ViewsUse jQuery and HTML/CSS to create a polyline timeline, where users can switch between events & event details by clicking on the vertices in the polygonal chain.
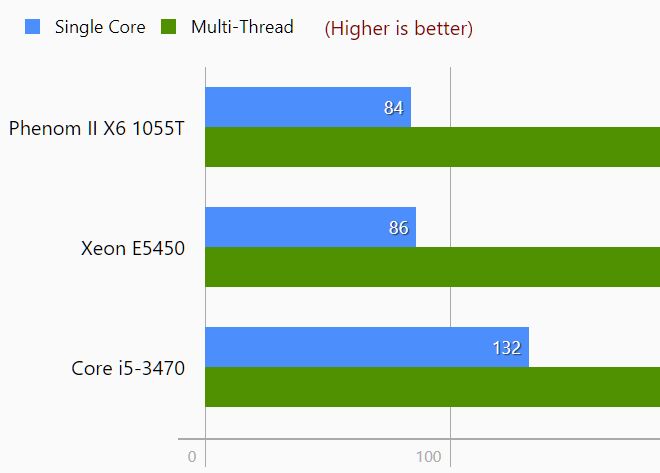
Horizontal Bar Chart Plugin - jQuery Devstratum JQP Graph
- Chart & Graph - 4090 ViewsA tiny jQuery plugin for plotting your numeric values in horizontal bar charts with titles, descriptions, labels, legends, x-axis/y-axis grids support.

Single & Stacked Horizontal Bar Chart Plugin - jQuery barChart
- Chart & Graph - 1401 ViewsA brand new plugin called barChat that can be used to create single or stacked horizontal bar charts from data sets defined in a JS array.

Progressive Enhancement Timeline Plugin - jQuery Timestack
- Chart & Graph - 3997 ViewsA responsive, flexible, progressive enhancement timeline plugin used to display your project events in chronological order.

Responsive Animated Column Chart Plugin - Draw Bar Chart
- Chart & Graph - 1300 ViewsA responsive and animated jQuery bar (column) chart plugin for drawing single-bar or stacked-bar charts on the page.
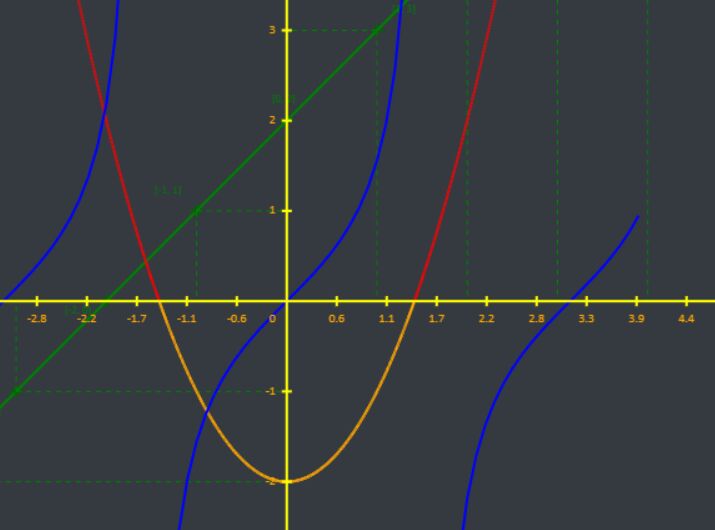
Create Customizable Scalable Math Graphs With jQuery smartGraph
- Chart & Graph - 1165 ViewsA powerful jQuery plugin that allows developers to draw dynamic, responsive, draggable, vector-shaped, infinitely scalable graphs using JavaScript and HTML5 canvas.
Linear Progress Indicator In jQuery - rProgressbar
- Chart & Graph - 10015 ViewsrProgressbar is a cross-browser, easy-to-use jQuery linear progress indicator which helps you generate an animated, customizable, horizontal bar based on a percentage.
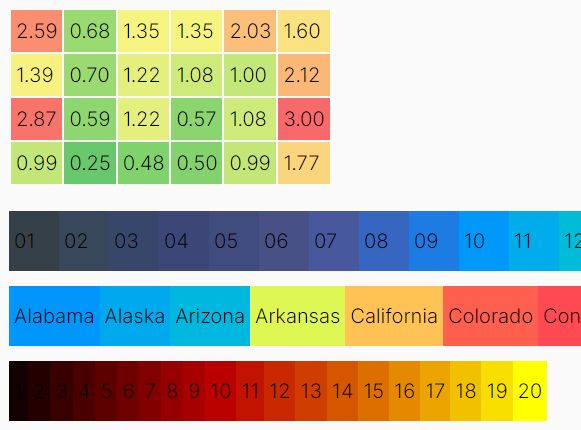
Create Heatmaps From Numerical Values In HTML Elements - jQuery Hottie
- Chart & Graph - 979 ViewsA jQuery heatmap plugin for formatting HTML elements (like table cells and list items) with a range of colors based on the calculated value of numerical data.
Animated Ring(Donut) Chart Plugin With jQuery And D3.js
- Chart & Graph - 1574 ViewsIf you're looking for an easy way to spice up your data visualizations, look no further than the animated donut chart plugin with jQuery and D3.js.
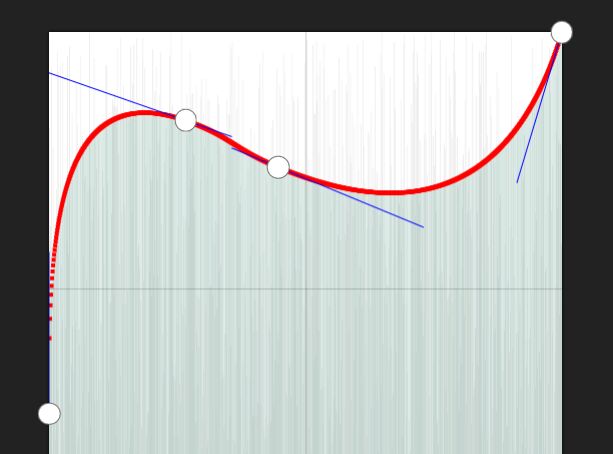
Create A Tone Curve UI Component In jQuery - iocurve
- Chart & Graph - 1261 ViewsA fully configurable jQuery plugin to create a Photoshop and Lightroom inspired Tone Curve UI where you can adjust points throughout a given value range via mouse drag.
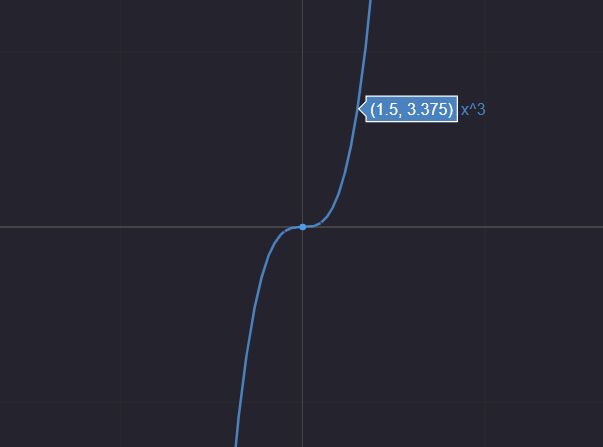
Fast Maths Function Plotter In JavaScript - Sidus
- Chart & Graph - 453 ViewsA simple and fast function plotter that helps generate zoomable, pannable, downloadable graphs of mathematical functions you provide.

Stacked Bar Graph With jQuery and D3.js - StackBars
- Chart & Graph - 551 ViewsA well-written, flexible plugin that facilitates the stacking of multiple bars to create a percent indicator graph.
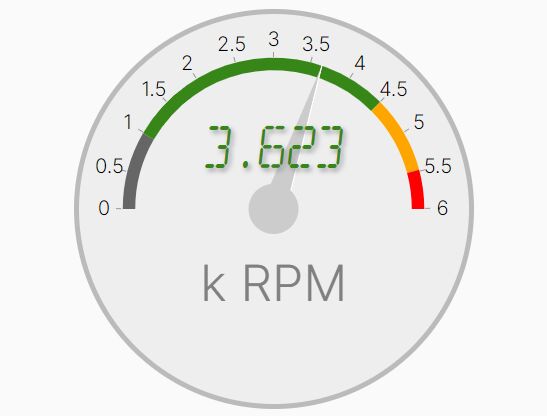
Analog/Digital Gauge Plugin - jQuery simplegauge.js
- Chart & Graph - 5337 ViewsA simple-to-use jQuery plugin that uses SVG and JavaScript to draw customizable Analog Gauges or Digital Gauges on the page.
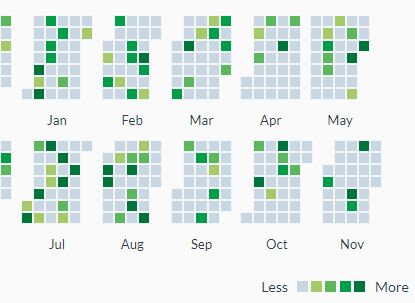
Calendar Heatmap Plugin With jQuery And Moment.js - CalendarHeatmap
- Chart & Graph - 15784 ViewsCalendarHeatmap.js is a jQuery plugin used to generate a dynamic, interactive, configurable calendar heatmap for representing time series data.