jQuery Chart & Graph Plugins
Download Free jQuery Pie Chart, Bar Chart, Donut Chart, Line Chart and other data visualization tools & plugins at our jQuery Chart & Graph Section. Page 11 .
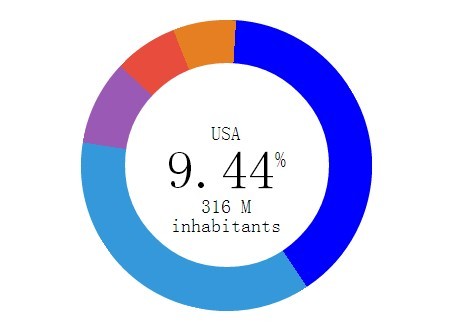
Creating A Flat Pie Chart with jQuery and CSS3 - piechart
- Chart & Graph - 12734 ViewsPiechart is a jQuery plugin that takes advantage of CSS3 and javascript to draw a flat style and responsive pie chart as a ring.

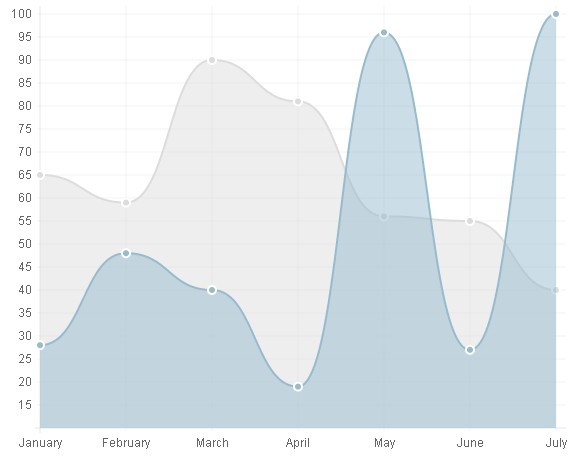
Lightweight jQuery Plugin For Drawing Waves with HTML5 - Wave
- Chart & Graph - 5145 ViewsWave is a lightweight (~2kb minified) jQuery plugin for drawing waves (Soundwave, ECG, Seismogram, etc) on your web page using HTML5 canvas 2D.
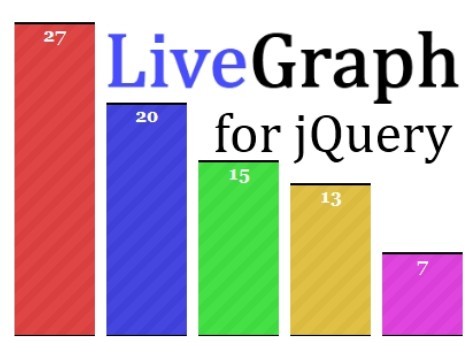
Dynamic & Animated jQuery Bar Charts Plugin - LiveGraph
- Chart & Graph - 20578 ViewsLiveGraph is a small jQuery graph plugin that dynamically generates live update bar charts from JSON data, html tables or ajax content.

Fancy jQuery Plugin For Border Chart - borderchart
- Chart & Graph - 860 ViewsjQuery Borderchart is a jQuery plugin that implements a chart in the form of a colored border around your html element.
Easy and Object Oriented Javscript Chart Library - Chart.js
- Chart & Graph - 7987 ViewsChart.js is a flexible and easy-to-use javascript chart library which takes advantage of HTML5 canvas tag to quickly create animated and nice look charts for your projects.
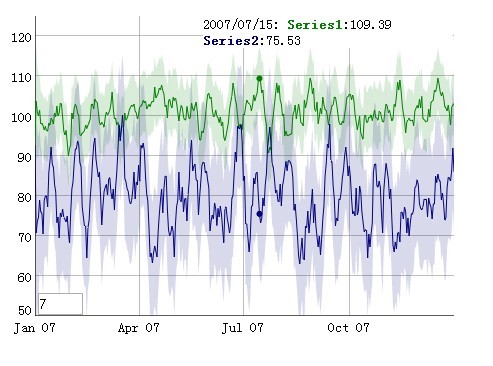
JS Interactive Visualizations Charts Library with HTML5 - dygraphs
- Chart & Graph - 2964 Viewsdygraphs is a javascript library for creating responsive, interactive and customizable charts with HTML5 canvas tag for your projects.
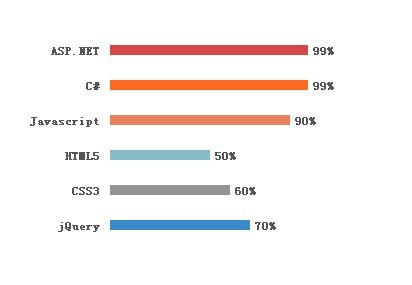
jQuery Animated Bar Plugin - jqBar
- Chart & Graph - 12749 ViewsjqBar is a jQuery plugin that make it easy to create Horizontal or Vertical for your project. It can be used as a progress bar or beautiful bar charts.
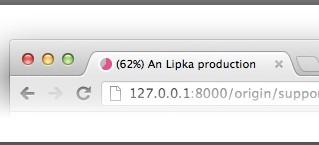
Display Progress Pie charts In Your favicon - piecon
- Chart & Graph - 1438 Viewspiecon is a small javascript library for generating progress pie charts in your favicon. It is very useful for download progress, upload progress, load progress and more.
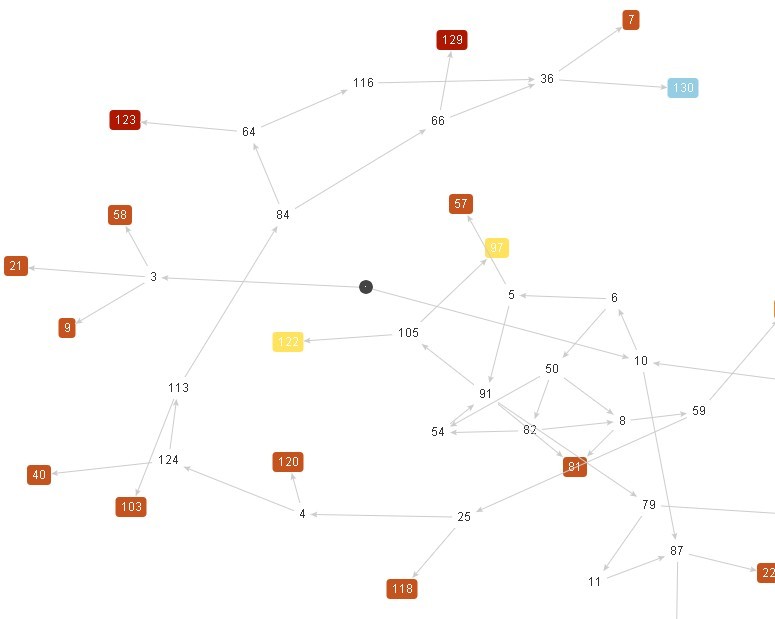
Graph Visualization Library With jQuery - Arbor
- Chart & Graph - 4118 ViewsArbor is a graph visualization library built with web workers and jQuery. Rather than trying to be an all-encompassing framework, arbor provides an efficient, force-directed layout algorithm plus abstractions for graph organization and scree
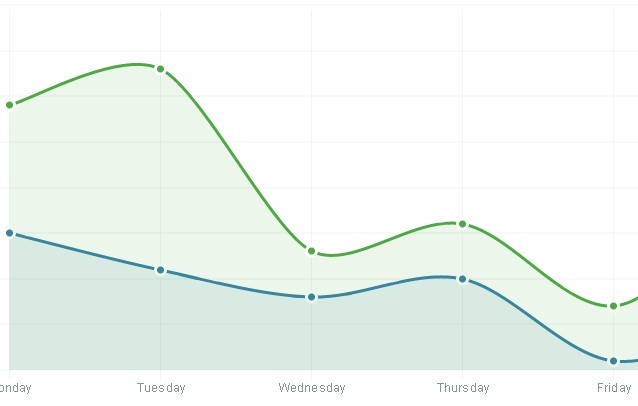
JavaScript Charts With SVG – xCharts
- Chart & Graph - 5553 ViewsxCharts is a JavaScript library using D3.js for building beautiful and custom data-driven chart visualizations for the web. Using HTML, CSS, and SVG, xCharts are designed to be dynamic, fluid, and open to integrations and customization.