jQuery Chart & Graph Plugins
Download Free jQuery Pie Chart, Bar Chart, Donut Chart, Line Chart and other data visualization tools & plugins at our jQuery Chart & Graph Section. Page 8 .
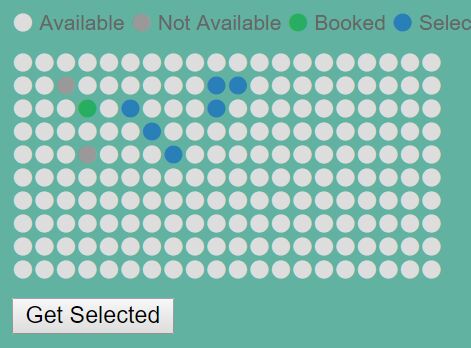
Minimalist Seating Chart Plugin with jQuery - flexiSeats
- Chart & Graph - 11148 ViewsflexiSeats is an ultra-light jQuery plugin used for generating a simple seating chart from plain HTML checkbox elements.
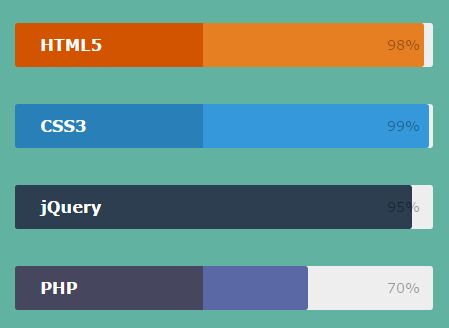
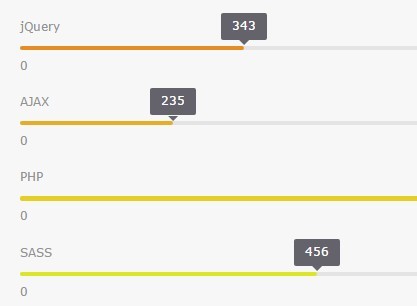
Animated Configurable Skill Bar Plugin with jQuery - Skills Bar
- Chart & Graph - 15861 ViewsSkills bar is a lightweight yet fully configurable jQuery plugin that creates animated horizontal bar indicators to showcase your skill / experience set in percentage.
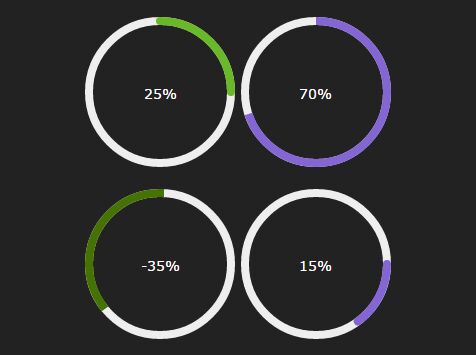
Circular Pie Chart & Progress Bar Plugin with jQuery and Canvas
- Chart & Graph - 32194 ViewsA dead simple jQuery plugin that uses HTML5 canvas to render animated, customizable, circular pie chart for representing percentage values or progress status.
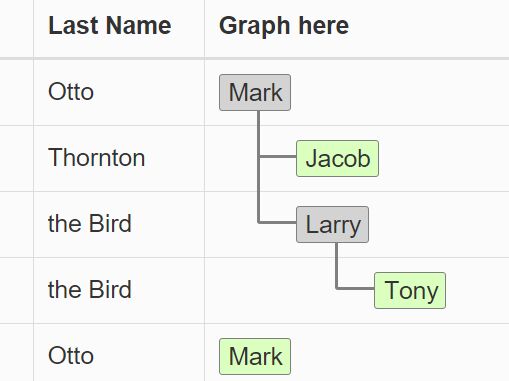
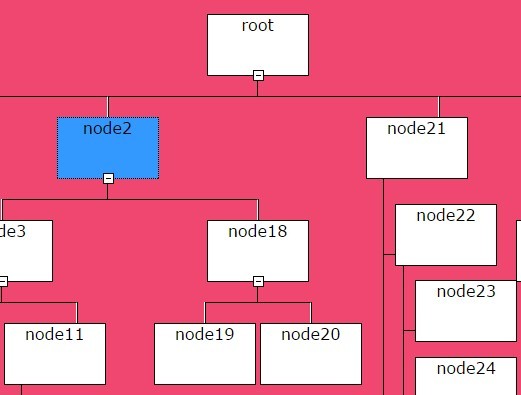
Treeview Style Hierarchical Table with jQuery and D3.js - Treetable
- Table - 27126 ViewsTreetable is a jQuery plugin used to visualize your hierarchical table rows into a collapsible tree graph using d3.js JavaScript library.
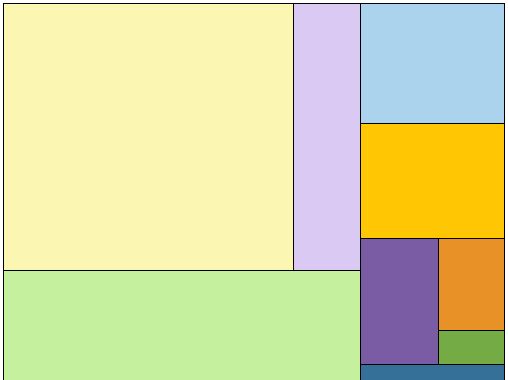
jQuery Plugin To Generate Simple Treemap Diagrams - Treemap.js
- Chart & Graph - 3082 ViewsTreemap.js is a simple tiny jQuery plugin that renders a clean treemap diagram with nested rectangles for representing hierarchical data on your webpage.
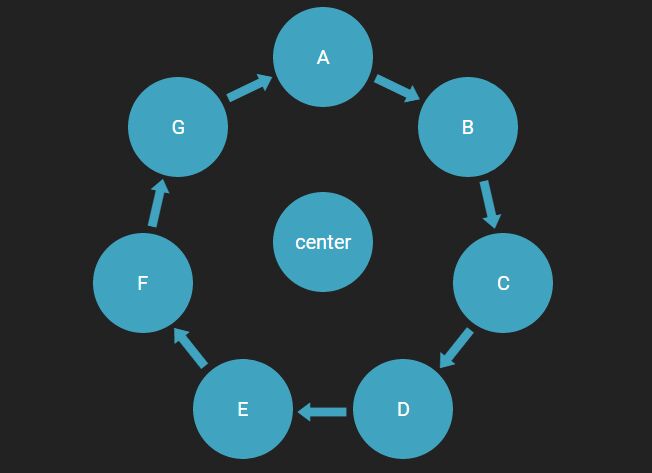
Animated Circle Diagram Plugin with jQuery - smartCycle.js
- Chart & Graph - 4010 ViewssmartCycle.js is a simple jQuery plugin used to render an animated, customizable circle diagram for presenting 'x' step cyclical progress.
Simple Hierarchical Organization Chart Plugin For jQuery - jOrgChart
- Chart & Graph - 33993 ViewsjOrgChart is a lightweight jQuery plugin that makes it easy to draw a hierarchical, collapsible organization chart from a nested html list.

Easy Animated Column Chart with jQuery and CSS - FaBoChart
- Chart & Graph - 1563 ViewsFaBoChart is a simple, lightweight yet customizable jQuery graph plugin that helps you visualize any numeric data into an animated column chart.
Responsive Customizable Bar Indicator with jQuery - Bars.js
- Chart & Graph - 9393 ViewsBars.js is a lightweight jQuery plugin that enables you visualize numeric data into responsive, dynamic, fully styleable bar indicators.

Create Material Design Style Charts using jQuery - Material Charts
- Chart & Graph - 15539 ViewsMaterial Charts is a lightweight jQuery plugin helps you create nice, clean, Material Design styled charts / diagrams with plain html, CSS and JavaScript.
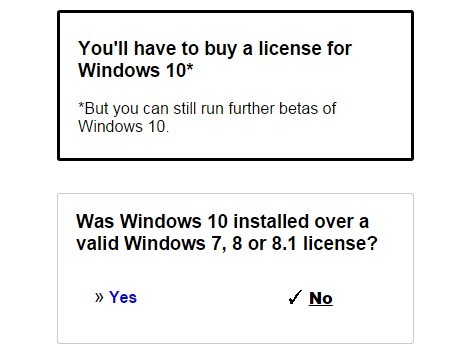
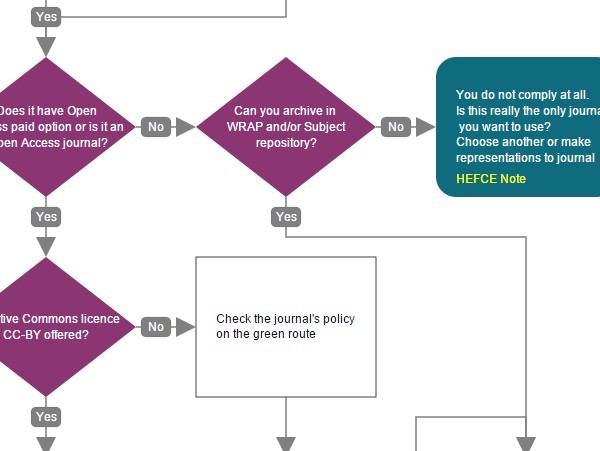
Accessible jQuery Decision Tree / Flowchart Plugin - decisionTree
- Chart & Graph - 12965 ViewsdecisionTree is a lightweight jQuery plugin used to generate an interactive, accessible, conditional, step-by-step decision tree or flowchart from JSON data.

Minimalist jQuery Pie Chart Plugin - Piegraph
- Chart & Graph - 5200 ViewsPiegraph is a super lightweight (~2kb unminified) jQuery plugin that renders a pure CSS based pie chart within a specified container.

Drawing Tournament Brackets with jQuery - Brackets.js
- Chart & Graph - 23955 ViewsBrackets.js is a simple lightweight jQuery plugin used to draw single elimination tournament brackets on your web page.
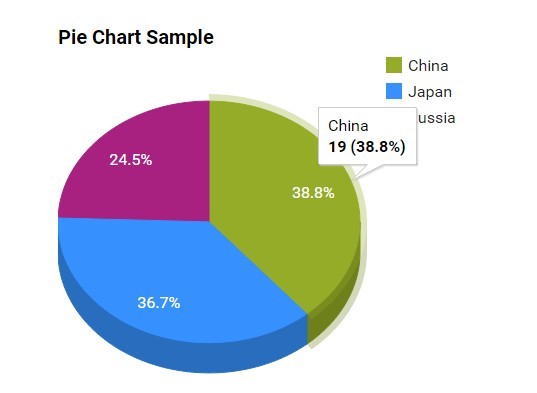
jQuery Plugin For Generating Google Charts From Tables - Chartinator
- Chart & Graph - 7683 ViewsChartinator is a jQuery data visualization plugin that makes use of Google Charts to render a variety of charts from existing table content.
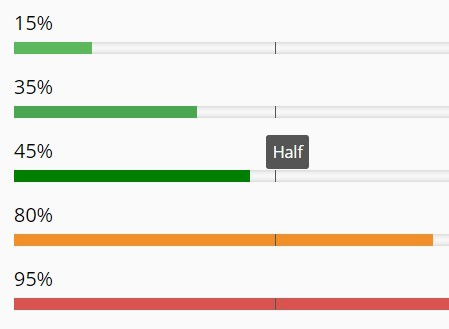
jQuery plugin To Visualize Numeric Data - Bar Indicator
- Chart & Graph - 5033 ViewsBar Indicator is a jQuery plugin that enables you to visualize numeric data as percentage or absolute numbers into fully customizable bars.

Basic Donut / Ring Chart Plugin with jQuery and Html5
- Chart & Graph - 6309 ViewsDonut is a very small jQuery plugin that uses Html5 Canvas 2D Context to visualize your data into a doughnut / ring chart.
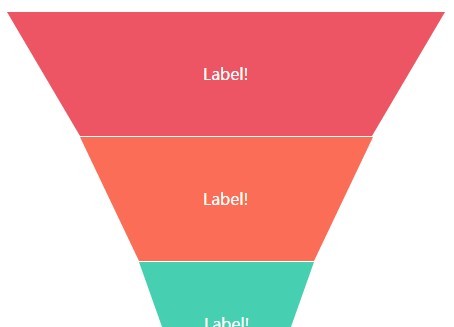
jQuery Plugin To Render Funnel Charts Using HTML / CSS - Funnel
- Chart & Graph - 7979 ViewsFunnel is a lightweight jQuery plugin for rendering cross-browser funnel charts with equal height segments using plain Html and CSS.
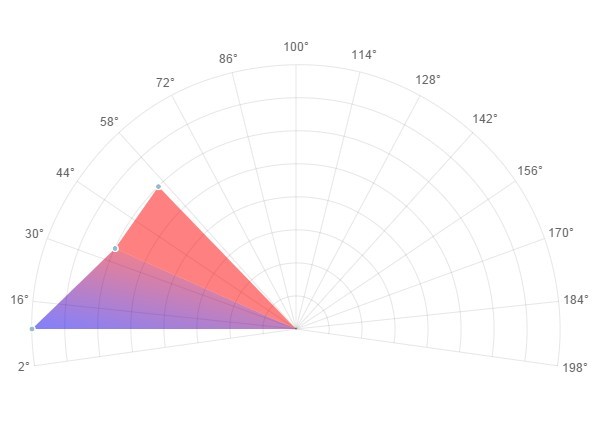
Simple Radar Chart Plugin with jQuery and Html5 Canvas - RadarChart.js
- Chart & Graph - 3965 ViewsRadarChart.js is a jQuery chart plugin which allows to present your multivariate data in a nice-looking radar chart using Html5 canvas 2D API.
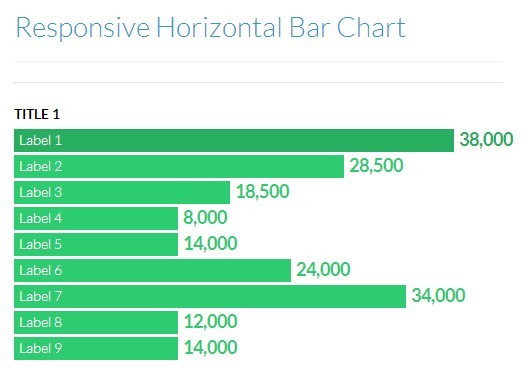
Responsive Animated Bar Chart with jQuery - Horizontal Chart
- Chart & Graph - 38006 ViewsHorizontal Chart is a super simple jQuery plugin used to create a responsive & animated bar chart.
Simple SVG Flow Chart Plugin with jQuery - flowSVG
- Chart & Graph - 60123 ViewsflowSVG is a jQuery diagram plugin that uses SVG.js to draw interactive and statistic flow charts for representing algorithms, workflows or processes.