Easy Animated Column Chart with jQuery and CSS - FaBoChart
| File Size: | 7.9 KB |
|---|---|
| Views Total: | 1552 |
| Last Update: | |
| Publish Date: | |
| Official Website: | Go to website |
| License: | MIT |

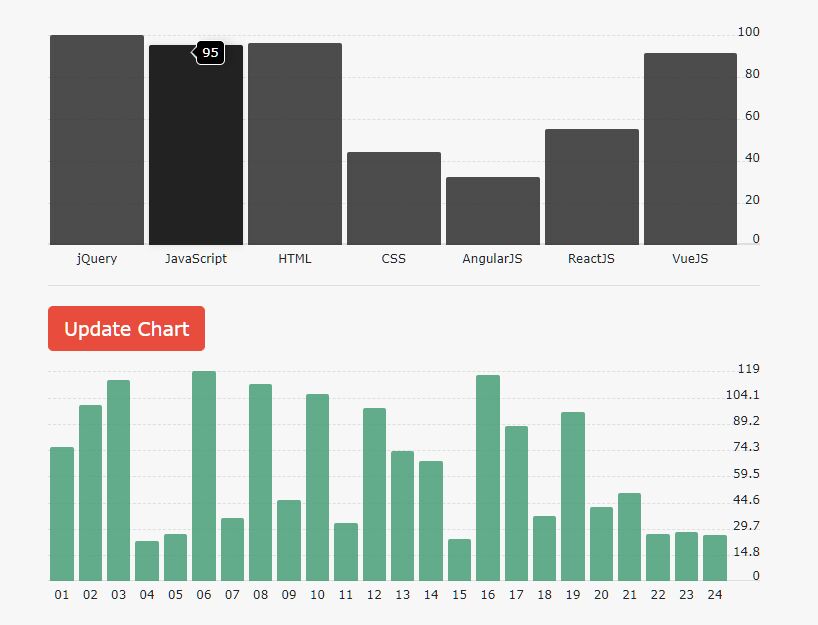
FaBoChart is a simple, lightweight yet customizable jQuery graph plugin that helps you visualize any numeric data into an animated column chart.
How to use it:
1. Include the required stylesheet fabochart.css in the head section of the html page.
<link href="styles/css/fabochart.css" rel="stylesheet">
2. Create a DIV element that will be severed as the container for your column chart.
<div id="chart"></div>
3. Define the dataset you want to present.
data = {
  '2010' : 300,
  '2011' : 200,
  '2012' : 100,
  '2013' : 500,
  '2014' : 400,
  '2015' : 200
};
4. Include jQuery library and the JavaScript file at the bottom of the html page.
<script src="//code.jquery.com/jquery-2.1.4.min.js"></script>
<script src="scripts/fabochart.js"></script>
5. Render a basic column chart inside the DIV element you just created.
$("#chart").faBoChart();
6. Customization options with default values.
$("#chart").faBoChart({

  // data you want to present
  data: {},

  // enable animation
  animate : true,

  // animation speed
  time : 2000,

  // instand animation
  instantAnimate : true,

  // angled columns
  straight : false,

  // value color
  valueColor : "#7b82ff",

  // background color
  backgroundColor : "#f4f6f7",

  // value text color
  valueTextColor : "#ffffff",

  // label color
  labelTextColor : "#95a5b3",

  // padding between columns
  gutter : "2px"

});
This awesome jQuery plugin is developed by Bolandish. For more Advanced Usages, please check the demo page or visit the official website.