Visualize Data Through A Column Chart - jQuery drawBarChart
| File Size: | 21.3 KB |
|---|---|
| Views Total: | 1538 |
| Last Update: | |
| Publish Date: | |
| Official Website: | Go to website |
| License: | MIT |
drawBarChart is a jQuery plugin which makes it easier to visualize your array data in a vertical bar (column) chart.
Features:
- Easy to use.
- Built with plain JavaScript/HTML/CSS. No SVG and Canvas.
- Custom x-axis and y-axis labels.
- Supports for stacked column chart.
- Allows you to specify the number of ticks.
How to use it:
1. Import the necessary Stylesheet and JavaScript files in the HTML file.
<link rel="stylesheet" href="/path/to/assets/stylesheets/styles.css" />
<script src="/path/to/cdn/jquery.slim.min.js"></script>
<script src="/path/to/assets/scripts/drawBarChart.js"></script>
2. Create a container to hold the column chart.
<div id="chart">
...
</div>
3. Prepare your chart data (numeric values) in a JS array.
let data = [5, 6, 4, 3, 12, 13, 12];
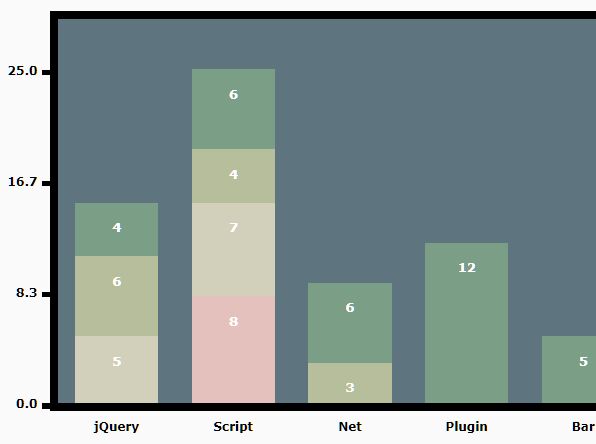
4. To create a stacked column chart, broken down the total amount into sub-amounts as follows:
let data = [[4, 6, 5], [6, 4, 7, 8], [6,3], 3, 12, 13, 12];
5. Config the column chart with the following settings.
let options = {
    width: 900,
    height: 600,
    barSpacing: 20,
    barLabelPosition: "top",
    barColour: ["#7B9E87", "#B6BE9C", "#D2D0BA", "#E5C1BD", "#A49CBF", "#9E7B91", "#BEE1E5"],
    barLegend: ["STEM Students", "Arts Students", "Psychology Students", "Nursing Students"],
    barLabelColour: ["white", "white", "white", "white"],
    barLabelFontSize: 14,
    // can be top, center, or bottom
    barLabelPosition: "center",
    // space between bar and top
    barPaddingTop: 50,
    legendFontSize: 15,
    legendBorderSize: 4,
    legendBoxSize: 10,
    xLabels: ["2017", "2018", "2019", "2020"],
    xLabelFontSize: 20,
    yTickCount: 4,
    yTickThickness: 5,
    yLabelFontSize: 15,
    yLabelDecimalCount: 0,
    yLabelColour: "black",
    yAxisTitle: "Number of Students",
    yAxisTitleFontSize: 17,
    chartTitle: "Graduating Class Size",
    titleFontSize: 30,
    titleFontColour: "black",
    chartBackgroundColour: "#5E747F",
    chartBorderColour: "black",
    borderWidth: 5
};
6. Determine the container element to hold the column chart. Default: <div />
let element = "#chart";
7. Draw a column chart on the page. That's it.
$(document).ready(
  drawBarChart(jQuery, data, options, element);
);
Changelog:
2020-05-09
- Optimized x and y label spacing.
2020-05-08
- Adjusted some of the styling to ensure a clean presentation.
2020-05-07
- Cleaned up functions in main drawBarChart function.
This awesome jQuery plugin is developed by alex-hladun. For more Advanced Usages, please check the demo page or visit the official website.


