jQuery Chart & Graph Plugins
Download Free jQuery Pie Chart, Bar Chart, Donut Chart, Line Chart and other data visualization tools & plugins at our jQuery Chart & Graph Section. Page 9 .
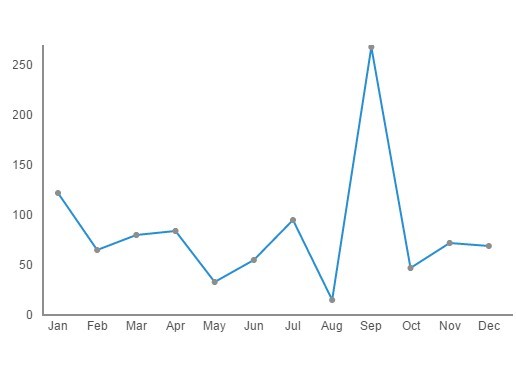
Simple Canvas Based Line Chart Plugin For jQuery - Topup
- Chart & Graph - 7290 ViewsTopup is a lightweight data visualization plugin used to draw a simple, intuitive line chart on the Canvas element.
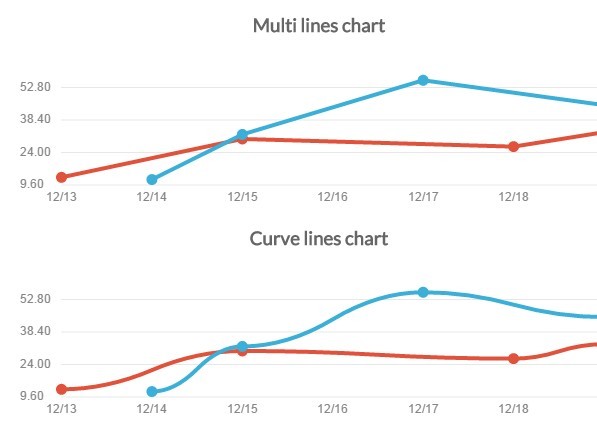
jQuery/Zepto Plugin For Pretty Line Charts - Pista.js
- Chart & Graph - 5511 ViewsPista.js is a small yet customizable graph plugin that makes it easy to display your data in a responsive pretty line chart based on canvas element.
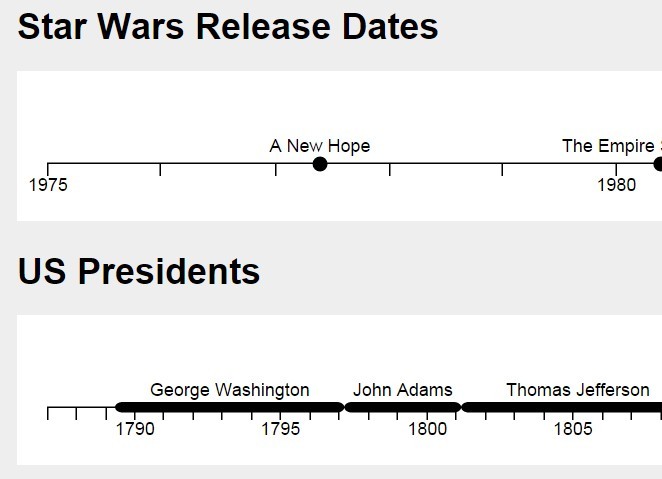
Drawing A Simple Horizontal Timeline with jQuery and SVG - timeframe.js
- Chart & Graph - 20195 Viewstimeframe.js is an easy-to-use jQuery plugin that draws a simple, horizontal, intuitive and SVG based timeline in your web project.
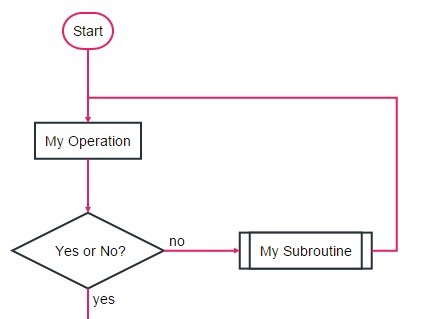
jQuery Plugin To Generate SVG Based Flowchart Diagram
- Chart & Graph - 30438 Viewsflowchart.js is a jQuery wrapper for Flowchart JS library that makes it easy to draw a vector based flowchart diagram using SVG and Raphaël.js.
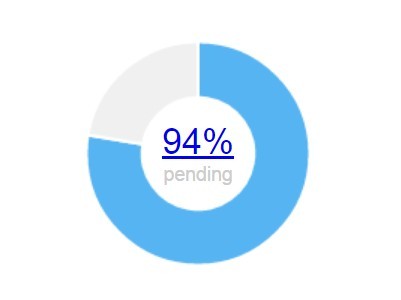
Create Pretty & Animated Donut Charts with jQuery and Chart.js
- Chart & Graph - 29026 ViewsA jQuery plugin to draw animated, doughnut chart style, circular progress indicators using Html5 canvas and chart.js JavaScript library.
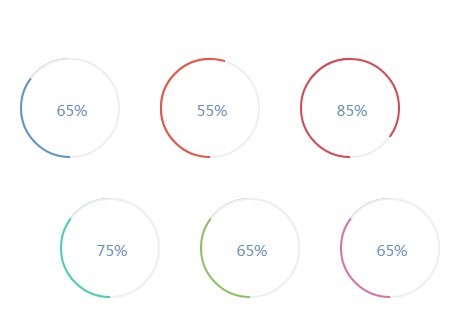
Smooth Circle Chart Plugin with jQuery and CSS3 - Circle Charts
- Chart & Graph - 50175 ViewsCircle Charts is a lightweight jQuery plugin to draws a CSS3 powered, animated, smooth circular chart/loader/progress bar that shows the data/progress in percentage.
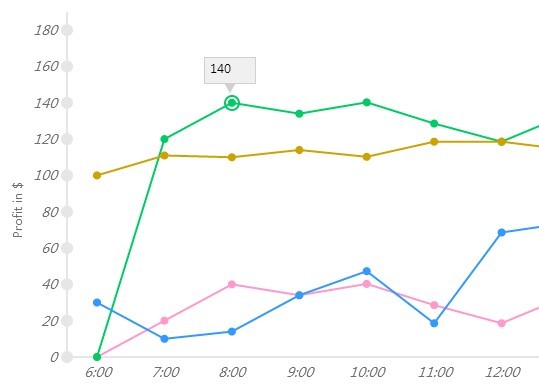
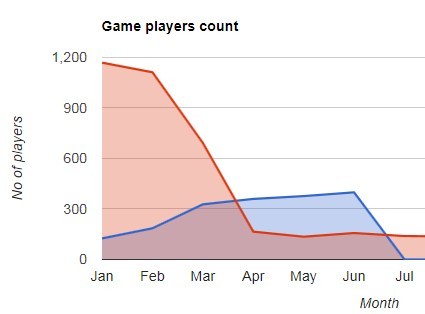
Lightweight Line/Area/Pie Chart Plugin with jQuery and Canvas
- Chart & Graph - 13568 ViewsA simple lightweight jQuery plugin that makes use of canvas & Javascript to produce an interactive Line, Area, Scattered, Bar, Hybrid, Pie chart with many configuration options.
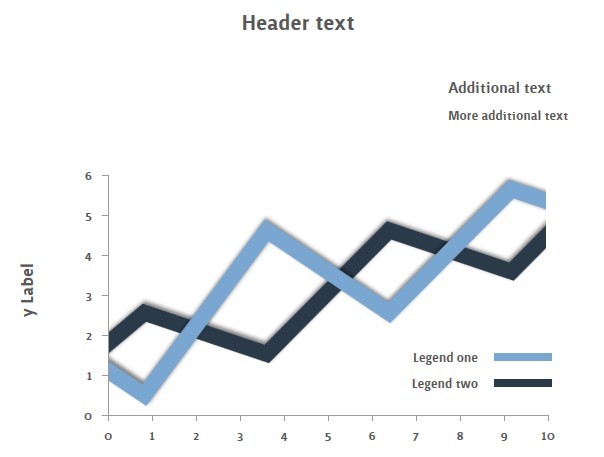
Animated SVG Bar/Line/Pie Chart Plugin with jQuery
- Chart & Graph - 4002 ViewsA lightweight yet powerful and customizable jQuery plotting plugin which enables you to draw animated bar/line/pie charts using Html, CSS and SVG.
Customizable and Animated jQuery & SVG Based Graph Plugin - Graph.js
- Chart & Graph - 9860 ViewsGraph.js is an interactivity and customizable jQuery plugin that makes use of HTML5 SVG to create animated linear, area, bar, combo, pie, and donut charts/graphs with support for multiple datasets.
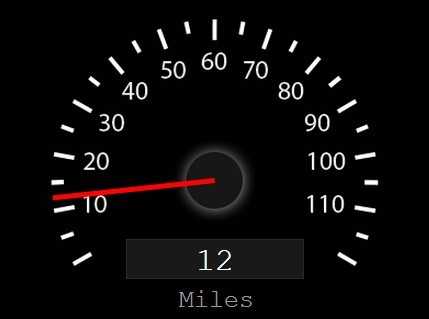
Creating A Dynamic Speedometer with jQuery and TweenLite - Speedometer
- Chart & Graph - 24631 ViewsVroom is a jQuery & TweenLite based gauge plugin for creating a realistic speedometer that dynamically updates according to user inputs.
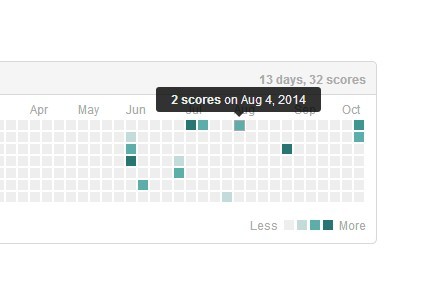
Github Like jQuery Data Visualization Plugin - Glance Year
- Chart & Graph - 9157 ViewsGlance Year is a jQuery data visualization plugin which helps you generate a Github contribution graph style calendar heatmap from a JS data array.
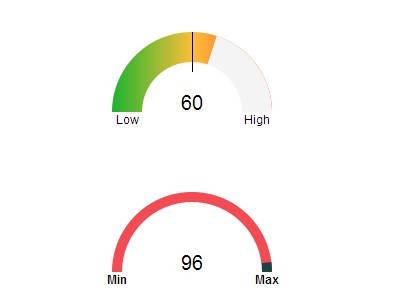
Creating Animated Gauges Using jQuery and Raphael.js - kumaGauge
- Chart & Graph - 46928 ViewskumaGauge is an easy jQuery plugin used to draw an animated & vector shaped semi-circular meter (Gauge) using Raphaël library.
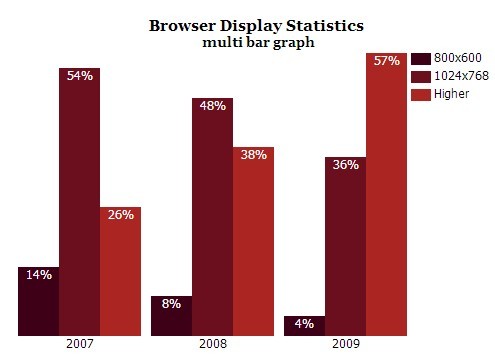
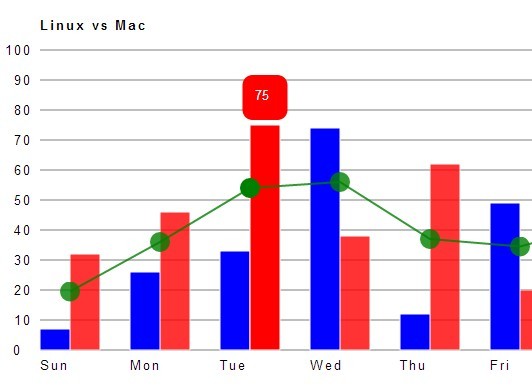
Animated Bar Diagram Plugin with jQuery - barGraph
- Chart & Graph - 12417 ViewsbarGraph is a jQuery bar chart plugin that helps you create animated single, multi, or stacked bar graphs with ease.
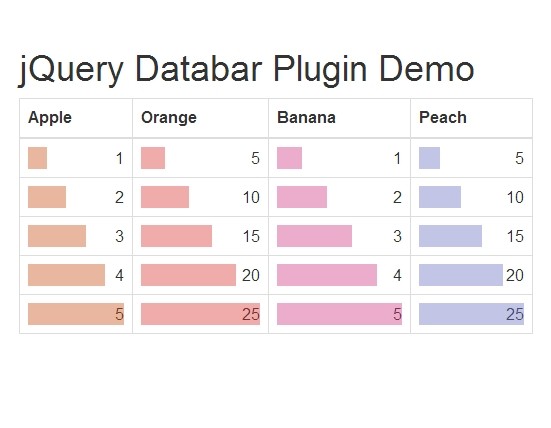
jQuery Plugin For Creating Excel-Like Data Bars - Databar
- Table - 5475 ViewsDatabar is a lite jQuery plugin that provides a simple way to represent data graphically inside the table cells, similar to the Microsoft Excel data bar.
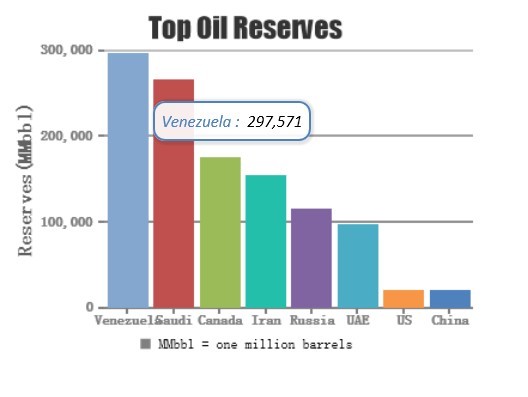
HTML5 & JavaScript Column Charts - CanvasJS
- Chart & Graph - 16952 ViewsCanvasJS is an HTML5 & JavaScript based Charting Library that runs on all modern devices including iPhone, Android, Desktops, etc.
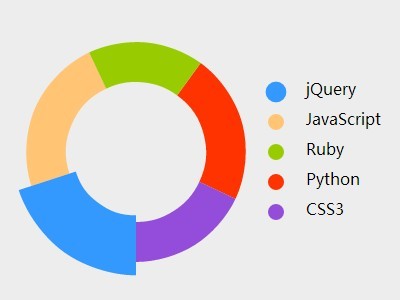
Animated Interactive Donut Chart with jQuery and Snap.svg
- Chart & Graph - 23229 ViewsA jQuery & SVG based chart script to draw an interactive donut chart with smooth SVG path animations based on Snap.svg JavaScript SVG library.
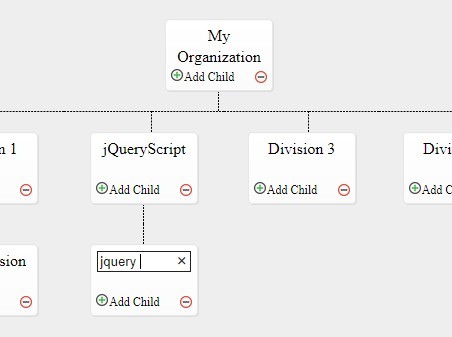
Create An Editable Organization Chart with jQuery orgChart Plugin
- Chart & Graph - 88480 ViewsorgChart is a jQuery plugin to generate a simple organization chart that shows the structure & the reporting relationship in your company.
jQuery Plugin To Generate Google Charts From Tables - gvChart
- Chart & Graph - 5579 ViewsgvChart is a minimal yet accessibility jQuery plugin that renders interactive Google charts from existing data tables to visualize data on your website.

jQuery Plugin To Create An Animated Canvas Graph - Codex Graph
- Chart & Graph - 5174 ViewsCodex Graph is a lightweight jQuery plugin used to create an animated knob-like graph from a list of items with Html5 data-pamt attributes.
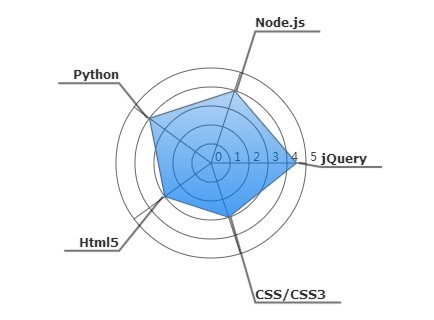
Simple Radar Chart Plugin with jQuery and Canvas - Radar Plus
- Chart & Graph - 7382 ViewsRadar Plus is a lightweight jQuery plugin helps you draw a polygonal graph (radar chart) on circles using Html5 canvas element.