Lightweight Line/Area/Pie Chart Plugin with jQuery and Canvas
| File Size: | 7.29 KB |
|---|---|
| Views Total: | 13521 |
| Last Update: | |
| Publish Date: | |
| Official Website: | Go to website |
| License: | MIT |
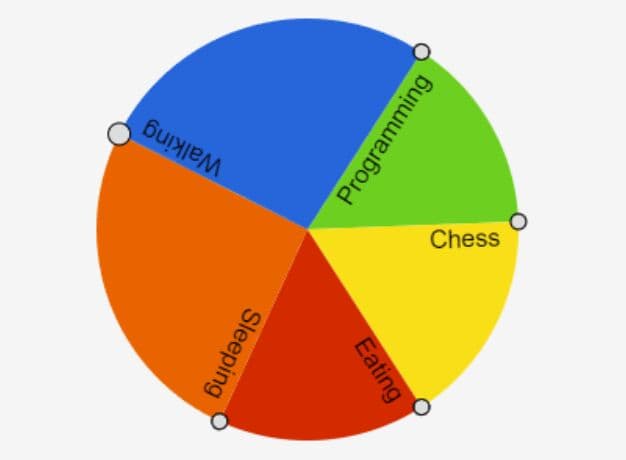
A simple lightweight jQuery plugin that makes use of canvas & Javascript to produce an interactive Line, Area, Scattered, Bar, Hybrid, Pie chart with many configuration options.
How to use it:
1. Load the latest version of jQuery library and the jQuery line chart plugin in your document.
<script src="//ajax.googleapis.com/ajax/libs/jquery/2.1.3/jquery.min.js" type="text/javascript"></script>
<script src="SimpleChart.js"></script>
2. Create an empty DIV element which will be served as a container for the line chart.
<div id="linegraph"> </div>
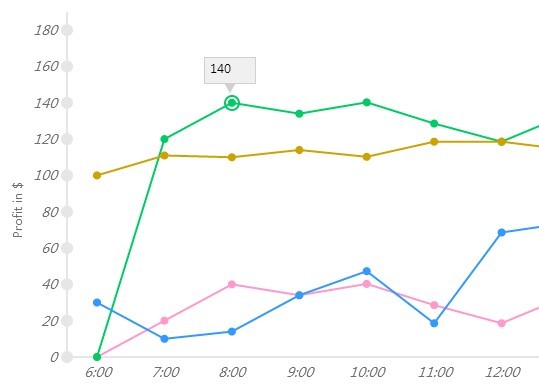
3. Prepare your plotted data using JavaScript arrays.
var graphdata1 = {
    linecolor: "#FF99CC",
    title: "Monday",
    values: [
    { X: "6:00", Y: 0.00 },
    { X: "7:00", Y: 20.00 },
    { X: "8:00", Y: 40.00 },
    { X: "9:00", Y: 34.00 },
    { X: "10:00", Y: 40.25 },
    { X: "11:00", Y: 28.56 },
    { X: "12:00", Y: 18.57 },
    { X: "13:00", Y: 34.00 },
    { X: "14:00", Y: 40.89 },
    { X: "15:00", Y: 12.57 },
    { X: "16:00", Y: 28.24 },
    { X: "17:00", Y: 18.00 },
    { X: "18:00", Y: 34.24 },
    { X: "19:00", Y: 40.58 },
    { X: "20:00", Y: 12.54 },
    { X: "21:00", Y: 28.00 },
    { X: "22:00", Y: 18.00 },
    { X: "23:00", Y: 34.89 },
    { X: "0:00", Y: 40.26 },
    { X: "1:00", Y: 28.89 },
    { X: "2:00", Y: 18.87 },
    { X: "3:00", Y: 34.00 },
    { X: "4:00", Y: 40.00 }
    ]
};
var graphdata2 = {
    linecolor: "#00CC66",
    title: "Tuesday",
    values: [
    { X: "6:00", Y: 0.00 },
    { X: "7:00", Y: 120.00 },
    { X: "8:00", Y: 140.00 },
    { X: "9:00", Y: 134.00 },
    { X: "10:00", Y: 140.25 },
    { X: "11:00", Y: 128.56 },
    { X: "12:00", Y: 118.57 },
    { X: "13:00", Y: 134.00 },
    { X: "14:00", Y: 140.89 },
    { X: "15:00", Y: 112.57 },
    { X: "16:00", Y: 128.24 },
    { X: "17:00", Y: 118.00 },
    { X: "18:00", Y: 134.24 },
    { X: "19:00", Y: 140.58 },
    { X: "20:00", Y: 112.54 },
    { X: "21:00", Y: 128.00 },
    { X: "22:00", Y: 118.00 },
    { X: "23:00", Y: 134.89 },
    { X: "0:00", Y: 140.26 },
    { X: "1:00", Y: 128.89 },
    { X: "2:00", Y: 118.87 },
    { X: "3:00", Y: 134.00 },
    { X: "4:00", Y: 180.00 }
    ]
};
var graphdata3 = {
    linecolor: "#3399FF",
    title: "Wednesday",
    values: [
    { X: "6:00", Y: 30.00 },
    { X: "7:00", Y: 10.00 },
    { X: "8:00", Y: 14.00 },
    { X: "9:00", Y: 34.00 },
    { X: "10:00", Y: 47.25 },
    { X: "11:00", Y: 18.56 },
    { X: "12:00", Y: 68.57 },
    { X: "13:00", Y: 74.00 },
    { X: "14:00", Y: 80.89 },
    { X: "15:00", Y: 42.57 },
    { X: "16:00", Y: 98.24 },
    { X: "17:00", Y: 108.00 },
    { X: "18:00", Y: 14.24 },
    { X: "19:00", Y: 14.58 },
    { X: "20:00", Y: 11.54 },
    { X: "21:00", Y: 48.00 },
    { X: "22:00", Y: 58.00 },
    { X: "23:00", Y: 34.89 },
    { X: "0:00", Y: 10.26 },
    { X: "1:00", Y: 148.89 },
    { X: "2:00", Y: 138.87 },
    { X: "3:00", Y: 164.00 },
    { X: "4:00", Y: 170.00 }
    ]
};
4. Initialize the plugin to draw a line chart into the DIV container you just created.
$(function () {
  $("#linegraph").LineChart({
    toolwidth: "50",
    toolheight: "25",
    axiscolor: "#E6E6E6",
    textcolor: "#6E6E6E",
    showlegends: true,
    data: [graphdata1, graphdata2, graphdata3],
    legendsize: "80",
    legendposition: 'bottom',
    xaxislabel: 'Hours',
    title: 'Weekly Profit',
    yaxislabel: 'Profit in $'
  });
});
5. The sample CSS to style the line chart.
.LineChart #tip {
  background-color: #f0f0f0;
  border: 1px solid #d0d0d0;
  position: absolute;
  left: -200px;
  top: 30px;
}

.down-triangle {
  width: 0;
  height: 0;
  border-top: 10px solid #d0d0d0;
  border-left: 6px solid transparent;
  border-right: 6px solid transparent;
  position: absolute;
  left: -200px;
}

.LineChart #highlighter {
  position: absolute;
  left: -200px;
}

.-line-chart-holder {
  float: left;
  position: relative;
  width: 100%;
  background-color: #fff;
  border: 1px solid #cecece;/*padding: 6px;*/
}

.LineChart .legendsli { list-style: none; }

.LineChart .legendsli span {
  float: left;
  vertical-align: middle;
}

.LineChart .legendsli span.legendindicator {
  position: relative;
  top: 5px;
}

.LineChart .legendsli span.legendindicator .line {
  width: 30px;
  height: 3px;
}

.LineChart .legendsli span.legendindicator .circle {
  width: 12px;
  height: 12px;
  border-radius: 20px;
  position: relative;
  top: -5px;
  right: 20px;
}

.line-chart-legends {
  background: #E7E7E7;
  border: 1px solid #d6d7dd;
  padding: 5px;
  margin: 2px 0px;
}

.line-chart-legends ul { }

.line-chart-legends ul li {
  display: inline;
  border-right: 1px solid #d6d7dd;
  float: left;
  padding: 10px;
}

.line-chart-legends ul li:last-child { border-right: 0px; }

.line-chart-legends.vertical { margin: 0px 10px; }

.line-chart-legends.vertical ul li {
  display: block;
  border: 0px;
  border-bottom: 1px solid #d6d7dd;
}

.line-chart-legends.vertical ul li:last-child { border-bottom: 0px; }

.line-chart-Header {
  position: absolute;
  font-size: 16px;
}
6. All the default configs.
$(function () {
  $("#linegraph").LineChart({
    ChartType: "Line", //Area, Scattered
    xPadding: 60,
    yPadding: 50,
    topmargin: 25,
    rightmargin: 20,
    data: null,
    toolwidth: 300,
    toolheight: 300,
    axiscolor: "#333",
    font: "italic 10pt sans-serif",
    headerfontsize: "14px",
    axisfontsize: "12px",
    textAlign: "center",
    textcolor: "#E6E6E6",
    showlegends: true,
    legendposition: 'bottom',
    legendsize: '100',
    xaxislabel: null,
    yaxislabel: null,
    title: null,
    LegendTitle: "Legend"
  });
});
Change logs:
2015-01-30
- Added Stacked, Stacked hybrid and enhancements to pie.
2015-01-23
- Added bar, hybrid, pie chart support.
2015-01-12
- added Area/Scatterred Chart support.
This awesome jQuery plugin is developed by moniecorleone. For more Advanced Usages, please check the demo page or visit the official website.