Animated SVG Bar/Line/Pie Chart Plugin with jQuery
| File Size: | 1.82 MB |
|---|---|
| Views Total: | 3983 |
| Last Update: | |
| Publish Date: | |
| Official Website: | Go to website |
| License: | MIT |
A lightweight yet powerful and customizable jQuery plotting plugin which enables you to draw animated bar/line/pie charts using Html, CSS and SVG.
More Examples:
How to use it (Bar chart):
1. Load the latest version of jQuery library and jquery.barchart.min.js script in the web page.
<script src="//ajax.googleapis.com/ajax/libs/jquery/1.11.2/jquery.min.js"></script>
<script src="js/jquery.barchart.min.js"></script>
2. Create an DIV element that will serve as a container for the bar chart.
<div id="my-chart"></div>
3. Call the plugin on the DIV container and setup the data & appearance options for your bar chart.
$('#my-chart').barchart({

'color': '#000',
'backgroundColor': '#fff',

'width': 400,
'height': 300,

'headerText': 'Header text',

// additionalText: can contain additional values, must specify the text, size, alignment
// and x,y position
'additionalText': [
  [ ['Additional text'], [7], ['right'], [50], [50] ],
  [ ['More additional text'], [6], ['right'], [50], [65] ]
],

'plotAreaLeft': 80,
'plotAreaRight': 350,
'plotAreaTop': 100,
'plotAreaBottom': 260,

'axisColor': '#000',

'yAxisValues': [ '0',
  '1',
  '2',
  '3',
  '4',
  '5',
  '6',
  '7',
  '8',
  '9',
  '10' ],

'yLabel': 'Label',
'yMaxValue': 10,

'xAxisValues': [ 'Bar one',
  'Bar two',
  'Bar three'
],

// dataValues: can contain 1 or more data planes, must specify the value and the label
'dataValues': [ [ [ 5, '5' ], [ 5.5, '5.5' ], [ 5.9, '5.9' ] ],
  [ [ 3.4, '3.4'], [ 3.8, '3.8'], [ 4, '4'] ],
  [ [ 6.3, '6.3'], [ 7, '7'], [ 7.2, '7.2'] ] ],

'planeBarColors': [ '#7AA6D2', '#838D96', '#2B3A49' ],
'planeLegend': [ 'Plane one', 'Plane two', 'Plane three' ],

});
4. All the default options (Bar chart).
'color': '#000',
'backgroundColor': '#fff',

'width': 400,
'height': 300,

'headerText': 'Header text',

// additionalText: can contain additional values, must specify the text, size, alignment
// and x,y position
'additionalText': [
  [ ['Additional text'], [7], ['right'], [50], [50] ],
  [ ['More additional text'], [6], ['right'], [50], [65] ]
],

'plotAreaLeft': 80,
'plotAreaRight': 350,
'plotAreaTop': 100,
'plotAreaBottom': 260,

'axisColor': '#000',

'yAxisValues': [ '0',
  '1',
  '2',
  '3',
  '4',
  '5',
  '6',
  '7',
  '8',
  '9',
  '10' ],

'yLabel': 'Label',
'yMaxValue': 10,

'xAxisValues': [ 'Bar one',
  'Bar two',
  'Bar three' ],

'markWidth': 3,

// dataValues: can contain 1 or more data planes, must specify the value and the label
'dataValues': [
  [ [ 5, '5' ], [ 5.5, '5.5' ], [ 5.9, '5.9' ] ],
  [ [ 3.4, '3.4'], [ 3.8, '3.8'], [ 4, '4'] ],
  [ [ 6.3, '6.3'], [ 7, '7'], [ 7.2, '7.2'] ]
],

'barSpacing': 15,
'barBorder': false,
'doubleBarSpacingBetweenBarsButNotBetweenBarAndPlotAreaBorder': true,

// for specifying colours for each bar
'barColors': [ '#ccc', '#aaa', '#bbb', '#eee' ],

// for specifying colours for bars on different planes
'planeBarColors': [ '#ccc', '#aaa', '#bbb' ],

// for specifying the plane legend labels
'planeLegend': [ 'Plane one', 'Plane two', 'Plane three' ],

'fontFamily': 'SurfaceMedium',


// for scaling: if any other charts should use the same data but display at different sizes,
// specify the chart with the default chart size here
'regularChartId': null,
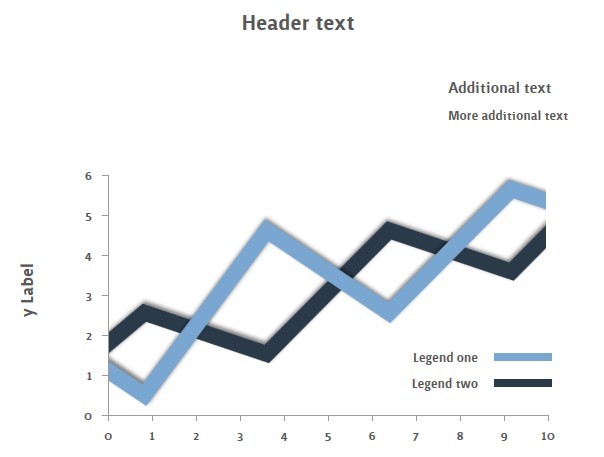
5. All the default options (Line chart).
'color': '#5A5758',
'backgroundColor': '#fff',

'width': 350,
'height': 300,

'headerText': 'Header text',

// additionalText: can contain additional values, must specify the text, size, alignment
// and x,y position
'additionalText': [
  [ ['Additional text'], [7], ['right'], [250], [50] ],
  [ ['More additional text'], [6], ['right'], [250], [65] ]
],

'plotAreaLeft': 80,
'plotAreaRight': 300,
'plotAreaTop': 100,
'plotAreaBottom': 220,

'axisColor': '#9C9C9B',

'yAxisValues': [ '0',
  '1',
  '2',
  '3',
  '4',
  '5',
  '6'
],

'yLabel': 'y Label',
'yMaxValue': 7,

'xAxisValues': [ '0',
  '1',
  '2',
  '3',
  '4',
  '5',
  '6',
  '7',
  '8',
  '9',
  '10'
],

'xLabel': 'x Label',
'xMaxValue': 24,

'markWidth': 3,

'planeColors': [ ],
'planeLegend': [ ],

// imageLayers: can contain 1 or more line images, must specify the source, width, height
// and x,y position
//'imageLayers': [ [ ['img/data.png'], [223], [236], [73], [60] ] ],
'imageLayers': [ ],

'legendAtBottom': false,
'dropLegendDownALittle': false,
'addMaskPadding': false,

'fontFamily': 'SurfaceMedium',

// for scaling: if any other charts should use the same data but display at different sizes,
// specify the chart with the default chart size here

'regularChartId': null,
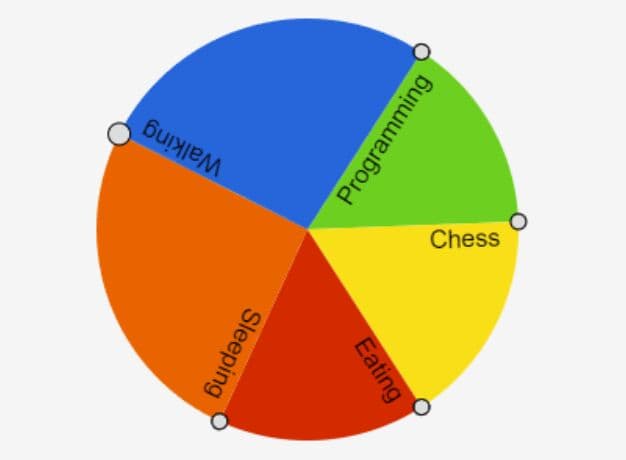
6. All the default options (Pie chart).
'color': '#f00',
'backgroundColor': '#fff',
'radius': 70,
'percentage': 70,
'label1': '',
'label2': '',

'fontFamily': 'SurfaceMedium, sans-serif',

// optimise for retina display ipad
'doubleSize': true,
This awesome jQuery plugin is developed by jackvz. For more Advanced Usages, please check the demo page or visit the official website.