Create Customizable Scalable Math Graphs With jQuery smartGraph
| File Size: | 54.8 KB |
|---|---|
| Views Total: | 1142 |
| Last Update: | |
| Publish Date: | |
| Official Website: | Go to website |
| License: | MIT |
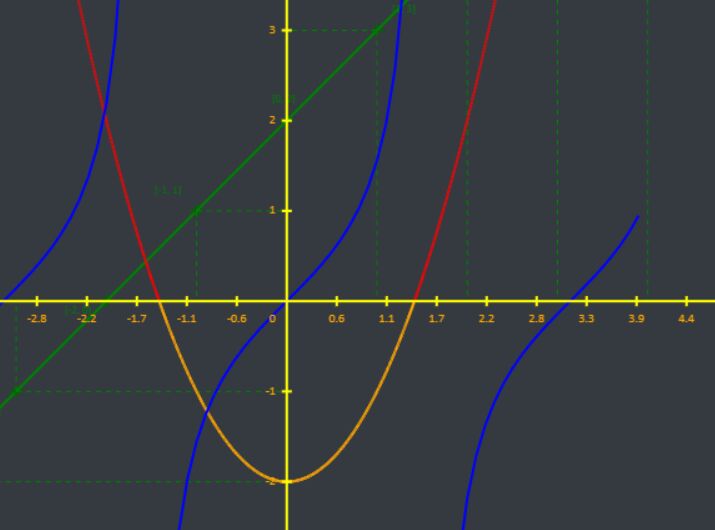
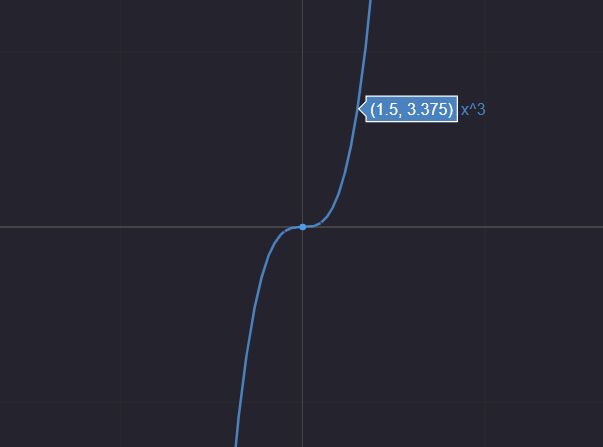
smartGraph is a powerful jQuery plugin that allows developers to draw dynamic, responsive, draggable, vector-shaped, infinitely scalable graphs using JavaScript and HTML5 canvas.
Useful in math app to generate graphs and diagrams representing data or values in an organized manner, such as graph of a function.
How to use it:
1. To get started, include jQuery JavaScript library and the smartGraph plugin's files on the web page.
<script src="/path/to/cdn/jquery.slim.min.js"></script>
<script src="/path/to/dist/js/jquery.smartGraph.min.js"></script>
<link rel="stylesheet" href="/path/to/dist/css/jquery.smartGraph.min.css" />
2. Create a canvas element to hold the graph.
<div class="smart-graph smart-graph-example">
  <canvas></canvas>
</div>
3. Create a basic cartesian coordinate system with custom ticks and labels.
$('.smart-graph-example').smartGraph({
  color: '#343a40',
  axises: {
    thickness: null,
    /* inherits from lines.thickness */
    color: null,
    /* inherits from lines.color */
    ticks: {
      step: 1,
      size: 8,
      thickness: null,
      /* inherits from axises.thickness */
      color: null,
      /* inherits from lines.color */
      titles: {
        font: '10px Calibri',
        padding: 10,
        color: null,
        /* inherits from texts.color */
        render: function(value, axisCreatorManager) {
          return axisCreatorManager.getOptimallyRoundedTick(value);
        }
      }
    },
    labels: {
      font: '20px Calibri',
      color: null /* inherits from texts.color */
    },
    x: {
      color: null,
      /* inherits from axises.color */
      label: {
        caption: 'x',
        color: null,
        /* inherits from axises.labels.color */
        padding: 20
      },
      ticks: {
        step: null,
        /* inherits from axises.ticks.step */
        color: null,
        /* inherits from axises.color */
        titles: {
          color: null,
          /* inherits from axises.ticks..titles.color */
          render: null /* inherits from axises.ticks.titles.render */
        }
      }
    },
    y: {
      color: null,
      /* inherits from axises.color */
      label: {
        caption: 'y',
        color: null,
        /* inherits from axises.labels.color */
        padding: 20
      },
      ticks: {
        step: null,
        /* inherits from axises.ticks.step */
        color: null,
        /* inherits from axises.color */
        titles: {
          color: null,
          /* inherits from axises.ticks.titles.color */
          render: null /* inherits from axises.ticks.titles.render */
        }
      }
    }
  },
  data: {
    points: [],
    functions: []
  },
  point: {
    size: 10,
    thickness: 2,
    color: null,
    /* inherits from color */
    hintlines: {
      show: false,
      color: null,
      /* inherits from lines.color */
      thickness: null,
      /* inherits from lines.thickness */
      dash: [2, 2]
    },
    label: {
      font: '13px Calibri',
      color: null,
      /* inherits from texts.color */
      padding: 7,
      render: function(x, y) {
        return '(' + x.roundDigits(2) + ', ' + y.roundDigits(2) + ')';
      }
    }
  },
  'function': {
    step: null,
    /* inherits from axises.x.ticks.step */
    modifier: function() {
      return null;
    },
    connectlines: {
      show: true,
      color: null,
      /* inherits from lines.color */
      thickness: null,
      /* inherits from lines.thickness */
      dash: []
    },
    points: {
      color: null,
      /* inherits from point.color */
      size: null,
      /* inherits from point.size */
      thickness: null,
      /* inherits from point.thickness */
      hintlines: {
        show: null,
        /* inherits from point.hintlines.show */
        color: null,
        /* inherits from point.hintlines.color */
        thickness: null,
        /* inherits from point.hintlines.thickness */
        dash: null /* inherits from point.hintlines.dash */
      },
      labels: {
        font: null,
        /* inherits from point.label.font */
        color: null,
        /* inherits from point.label.color */
        padding: null,
        /* inherits from point.label.padding */
        render: function() {
          return '';
        }
      }
    }
  },
  lines: {
    color: null,
    /* inherits from color */
    thickness: 1
  },
  texts: {
    color: null /* inherits from color */
  },
  move: {
    x: 0,
    y: 0
  },
  responsive: {
    enable: true,
    ratio: 16 / 9
  }
});
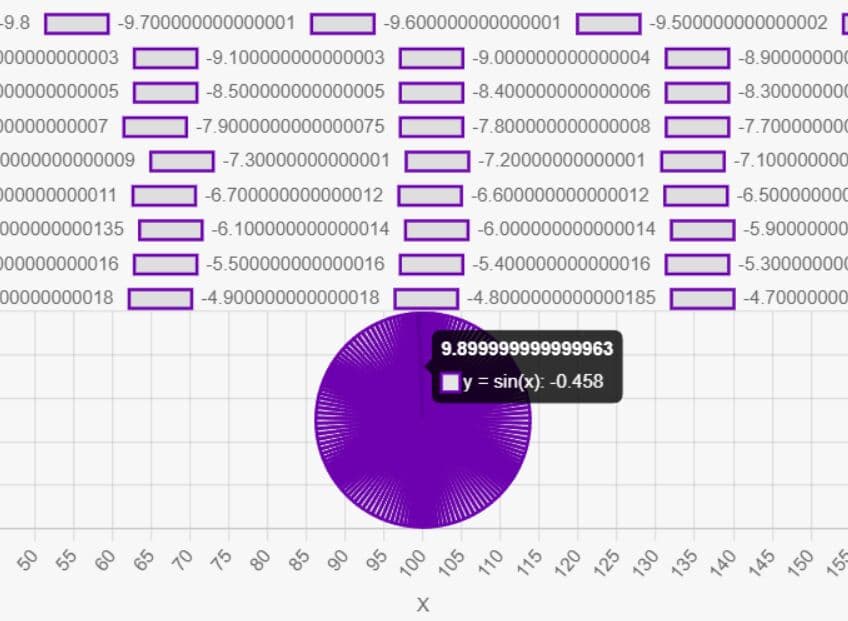
4. Add data (points and functions) to the cartesian coordinate system.
$('.smart-graph-example').smartGraph('addData', {
  points: [{
    x: -2,
    y: -2
  }],
  functions: [{
    relation: x => Math.sin(x),
    step: .1,
    interval: [-4, 4],
    points: {
      size: 0
    }
  }]
})
5. The plugin also allows the user to add custom using the smartGraph.click event.
$('.smart-graph-example').attr('title', 'click to draw a point').on('smartGraph.click', function(_e, _settingsManager, x, y) {
  $(this).smartGraph('addData', {
    points: [{
      x: x,
      y: y,
      color: 'red',
      size: 9,
      thickness: 2,
      hintlines: {
        color: 'darkred',
        dash: [3, 4]
      },
      label: {
        color: 'red',
        render: function(x, y) {
          return x.toFixed(2) + ', ' + y.toFixed(2);
        }
      }
    }]
  });
})
6. All default options to customize the graph.
$('.smart-graph-example').smartGraph({
  color: '#343a40',
  axises: {
    thickness: null, /* inherits from lines.thickness */
    color: null, /* inherits from lines.color */
    ticks: {
        step: 1,
        size: 8,
        thickness: null, /* inherits from axises.thickness */
        color: null, /* inherits from lines.color */
        titles: {
            font: '10px Calibri',
            padding: 10,
            color: null, /* inherits from texts.color */
            render: function (value, axisCreatorManager) {
                return axisCreatorManager.getOptimallyRoundedTick(value);
            }
        }
    },
    labels: {
        font: '20px Calibri',
        color: null  /* inherits from texts.color */
    },
    x: {
        color: null, /* inherits from axises.color */
        label: {
            caption: 'x',
            color: null,  /* inherits from axises.labels.color */
            padding: 20
        },
        ticks: {
            step: null, /* inherits from axises.ticks.step */
            color: null, /* inherits from axises.color */
            titles: {
                color: null, /* inherits from axises.ticks..titles.color */
                render: null /* inherits from axises.ticks.titles.render */
            }
        }
    },
    y: {
        color: null, /* inherits from axises.color */
        label: {
            caption: 'y',
            color: null, /* inherits from axises.labels.color */
            padding: 20
        },
        ticks: {
            step: null, /* inherits from axises.ticks.step */
            color: null, /* inherits from axises.color */
            titles: {
                color: null, /* inherits from axises.ticks.titles.color */
                render: null /* inherits from axises.ticks.titles.render */
            }
        }
    }
  },
  data: {
    points: [],
    functions: []
  },
  point: {
    size: 10,
    thickness: 2,
    color: null, /* inherits from color */
    hintlines: {
        show: false,
        color: null, /* inherits from lines.color */
        thickness: null, /* inherits from lines.thickness */
        dash: [2, 2]
    },
    label: {
        font: '13px Calibri',
        color: null, /* inherits from texts.color */
        padding: 7,
        render: function (x, y) {
            return '(' + x.roundDigits(2) + ', ' + y.roundDigits(2) + ')';
        }
    }
  },
  'function': {
    step: null, /* inherits from axises.x.ticks.step */
    modifier: function () {
        return null;
    },
    connectlines: {
        show: true,
        color: null, /* inherits from lines.color */
        thickness: null, /* inherits from lines.thickness */
        dash: []
    },
    points: {
        color: null, /* inherits from point.color */
        size: null, /* inherits from point.size */
        thickness: null, /* inherits from point.thickness */
        hintlines: {
            show: null, /* inherits from point.hintlines.show */
            color: null, /* inherits from point.hintlines.color */
            thickness: null, /* inherits from point.hintlines.thickness */
            dash: null /* inherits from point.hintlines.dash */
        },
        labels: {
            font: null, /* inherits from point.label.font */
            color: null, /* inherits from point.label.color */
            padding: null, /* inherits from point.label.padding */
            render: function () {
                return '';
            }
        }
    }
  },
  lines: {
    color: null, /* inherits from color */
    thickness: 1
  },
  texts: {
    color: null /* inherits from color */
  },
  move: {
    x: 0,
    y: 0
  },
  responsive: {
    enable: true,
    ratio: 16 / 9
  }
})
7. API methods.
// update options
$('.smart-graph-example').smartGraph('setOptions', {
  // options here
});

// add data
$('.smart-graph-example').smartGraph('addData', {
  points: [
    {
      x: 4,
      y: -2
    }
  ]
});

// update data
$('.smart-graph-example').smartGraph('updateData', {
  points: [
    {
      x: 4,
      y: -2
    }
  ]
});

// move the graph
$('.smart-graph-example').smartGraph('moveUp');
$('.smart-graph-example').smartGraph('moveDown');
$('.smart-graph-example').smartGraph('moveLeft');
$('.smart-graph-example').smartGraph('moveRight');

// zoom in/out the graph
$('.smart-graph-example').smartGraph('zoomIn');
$('.smart-graph-example').smartGraph('zoomOut');
Changelog:
2022-01-03
- v1.3.0: refactor, click event arguments, function rendering optimalization, exception handling
2021-01-28
- v1.2.0
2021-01-04
- IE bugfixes, mousemove cross browsers support, finger touch move support
This awesome jQuery plugin is developed by oplaner4. For more Advanced Usages, please check the demo page or visit the official website.