Fast Maths Function Plotter In JavaScript - Sidus
| File Size: | 3.38 MB |
|---|---|
| Views Total: | 428 |
| Last Update: | |
| Publish Date: | |
| Official Website: | Go to website |
| License: | MIT |
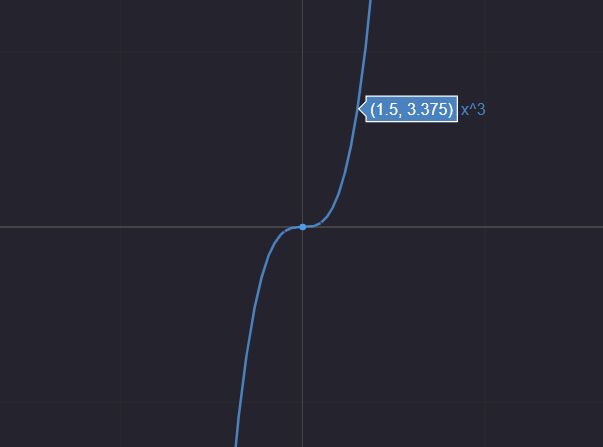
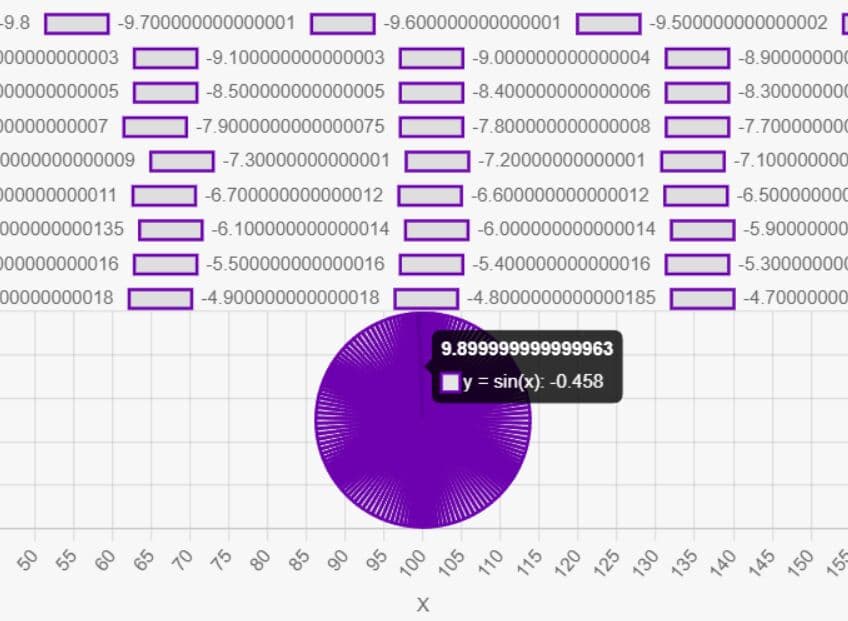
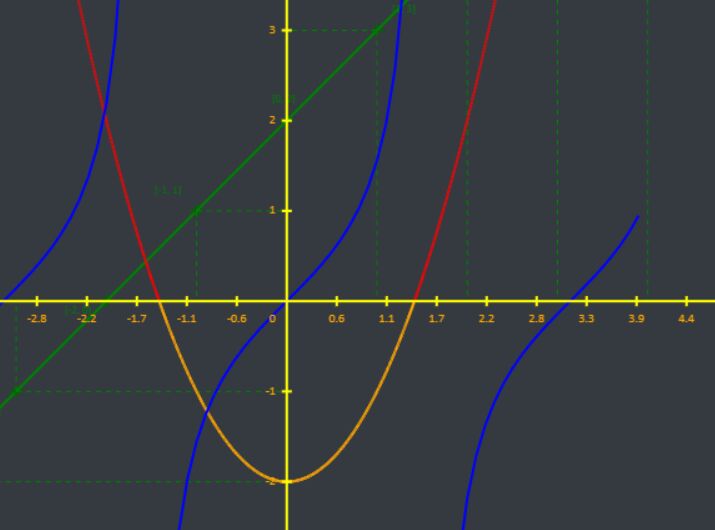
Sidus is a simple and fast function plotter that helps generate zoomable, pannable, downloadable graphs of mathematical functions you provide.
How to use it:
1. Load jQuery and other resources in the document. All dependencies:
- mathlive: A web component for easy math input
- math.js: An extensive math library for JavaScript and Node.js
- Plotly: A free and open-source graphing library for JavaScript.
- jQuery Library
- Bootstrap framework
<!-- mathlive -->
<script src="/path/to/cdn/mathlive.min.js"></script>
<!-- Math.js -->
<script src="/path/to/cdn/math.js"></script>
<!-- Plotly -->
<script src="/path/to/cdn/plotly-latest.min.js"></script>
<!-- jQuery -->
<script src="/path/to/cdn/jquery.min.js"></script>
<!-- Bootstrap -->
<link rel="stylesheet" href="/path/to/cdn/bootstrap.min.css" />
<script src="/path/to/cdn/bootstrap.bundle.min.js"></script>
2. Load the function plotter's files in the document.
<link rel="stylesheet" href="plotertestui.css" />
<script src="plotter2.0.js"></script>
3. Create the HTML for the function plotter.
<div class="container-fluid mb-0">
  <div class="row h-100">
    <div class="col-md-4 col-12 col-lg-3 h-md-100 p-2 " id="controls">
      <ul class="w-100 p-0" id="functionslist">
        <li class=" mt-2 mb-1 row funcitem m-2">
          <div class="col-2 text-center p-0 pt-2 funcnot">f(x) =</div>
          <math-field class="col-8 p-0 " id="inputfunc" onchange="plotgraph()"></math-field>
          <button class="col-2 p-0 butn" onClick="findderivative()">f'(x)</button>
        </li>
      </ul>
    </div>
    <main class="col-md-8 col-12 col-lg-9 h-md-100" id="workspace">
      <div id="plotarea"></div>
    </main>
  </div>
</div>
Changelog:
2021-11-28
- CSS & JS update
This awesome jQuery plugin is developed by beetrandahiya. For more Advanced Usages, please check the demo page or visit the official website.