jQuery Chart & Graph Plugins
Download Free jQuery Pie Chart, Bar Chart, Donut Chart, Line Chart and other data visualization tools & plugins at our jQuery Chart & Graph Section. Page 3 .
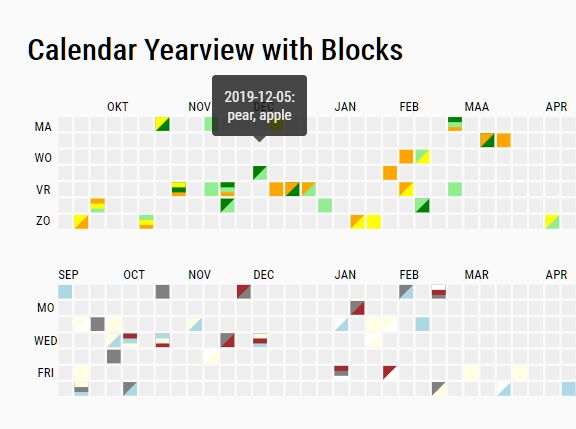
jQuery Plugin For Github Style Heatmap Calendar - Contribution Graph
- Chart & Graph - 6216 ViewsA jQuery plugin that renders a Github style, SVG based calendar heatmap for user profiles to represent time series data. Inspired by Github's contribution calendar graph.
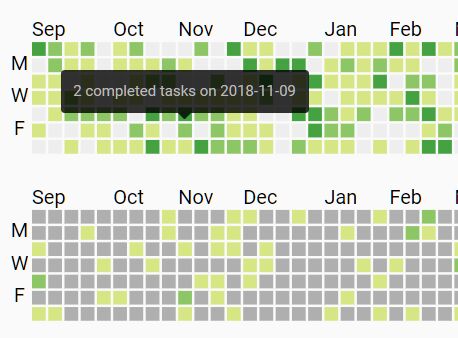
Github Style Calendar Heatmap In jQuery
- Chart & Graph - 4534 ViewsJust another jQuery plugin that dynamically renders a calendar heatmap (year view) to visualize time series data (like activities, contribution) similar to Github contribution graph.

Drag And Drop Flowchart Builder - Flowy.js
- Chart & Graph - 59169 ViewsFlowy.js is a pretty nice and user-friendly flowchart builder to create responsive, professional flowchart using drag and drop.

Create Flexible Seating Layouts With jQuery - seatLayout.js
- Chart & Graph - 10255 ViewsA jQuery plugin to help developers create flexible, customizable seating layouts that can be useful in movie/theater/airline seat booking system.
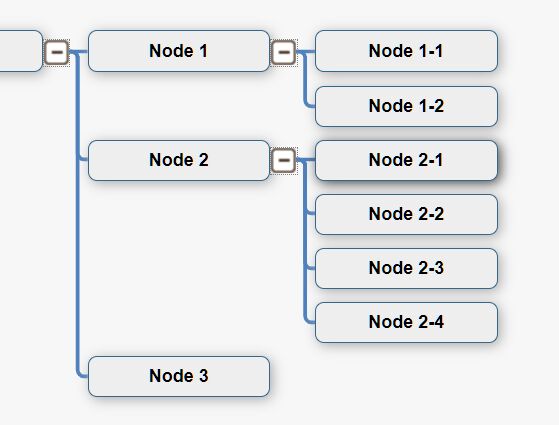
Dynamic Tree View With Visual Connections - jsPlumbTree
- Chart & Graph - 21328 ViewsA jQuery plugin that renders a collapsible and expandable tree structure representing the hierarchical relationship between various nodes.
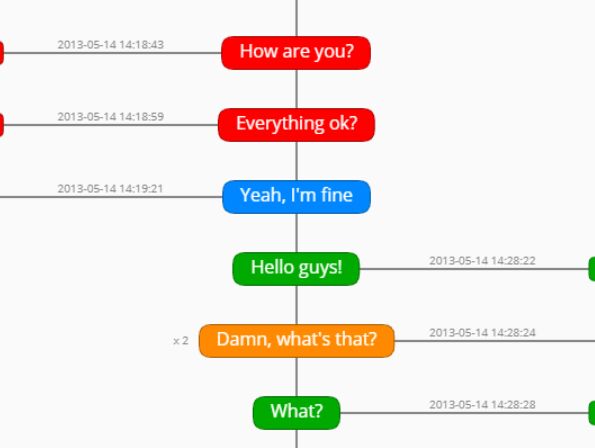
Visualize Events On A Timeline Using Canvas - Ironsys Timeline
- Chart & Graph - 4182 ViewsIronsys Timeline is a simple, customizable jQuery data visualization plugin to visualize time based events on a timeline using canvas.

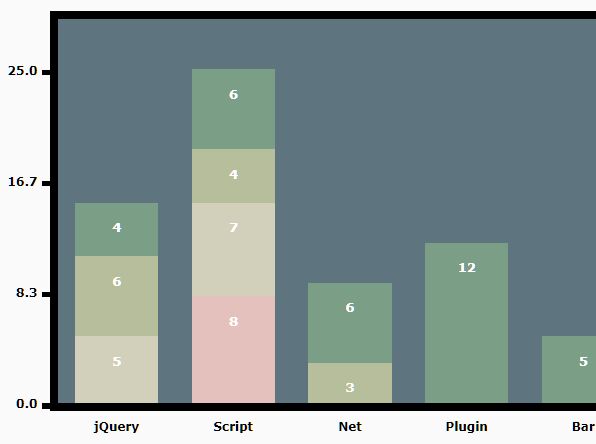
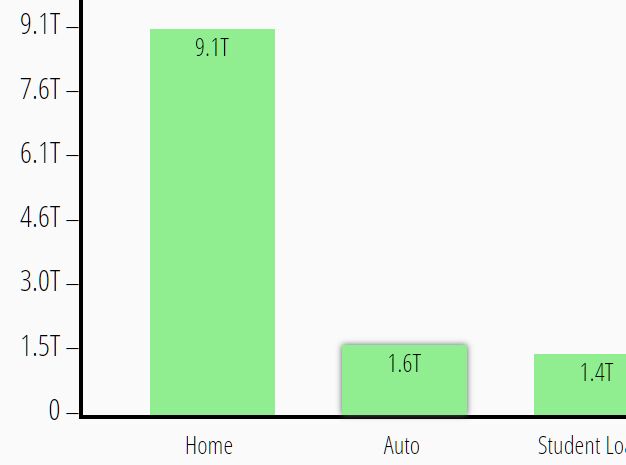
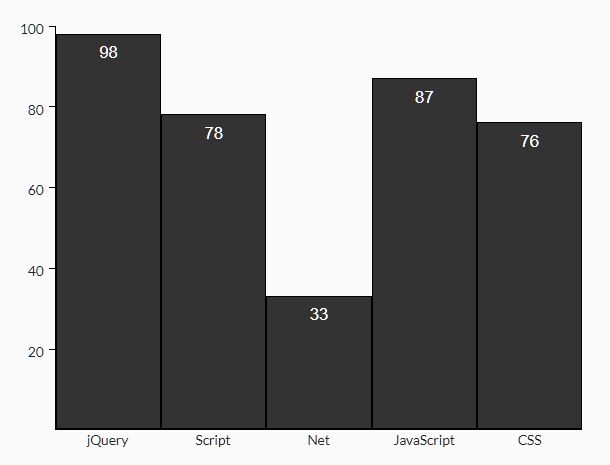
Simple Plain Column Chart Generator In jQuery - bar-chart.js
- Chart & Graph - 3347 ViewsA lightweight yet customizable jQuery bar chart plugin to generate a responsive, vertical, standard or stacked column chart using plain HTML, CSS, JavaScript.
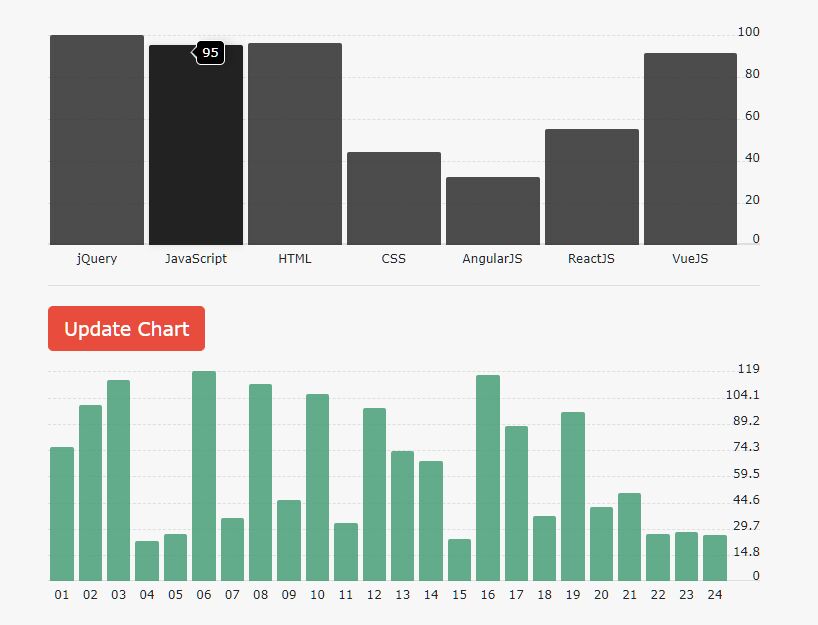
Generate Animated Column Charts From JS Array - Simple Bar Graph
- Chart & Graph - 4920 ViewsA simple bar graph jQuery plugin (~2kb minified) that takes data from a JavaScript array containing keys and values and converting them into an animated column chart.
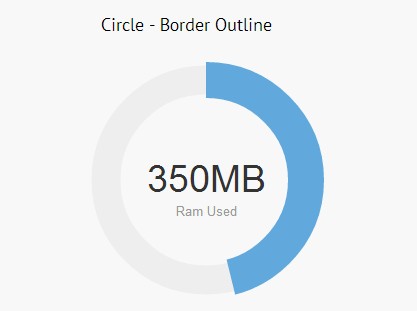
Animated Circle Statistics Plugin With Canvas - Circliful
- Chart & Graph - 53352 ViewsCircliful is a jQuery chart plugin that animates the presentation of your information with good looking circular design, a little similar to the ring chart.
Visualize Data Through A Column Chart - jQuery drawBarChart
- Chart & Graph - 1561 ViewsdrawBarChart is a jQuery plugin which makes it easier to visualize your array data in a vertical bar (column) chart.

Drag'n'drop Flow Chart Plugin With jQuery And jQuery UI - flowchart.js
- Chart & Graph - 77769 Viewsflowchart.js is a jQuery & jQuery UI based flowchart plugin which enables you to create drag'n'drop flowchart boxes and connect between them with a custom line.
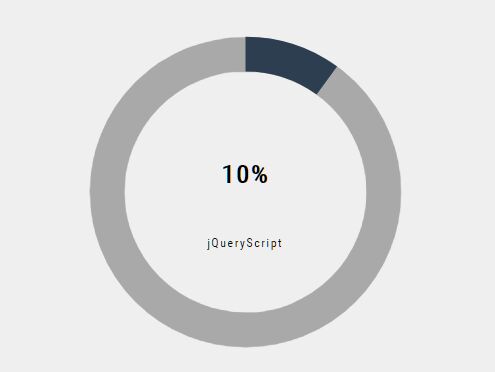
Minimal SVG Percentage Circle Plugin - PercentChart.js
- Chart & Graph - 4364 ViewsA jQuery plugin to render an SVG based circular progress bar & loading bar that fills up with a given duration based on percentage data you specify.
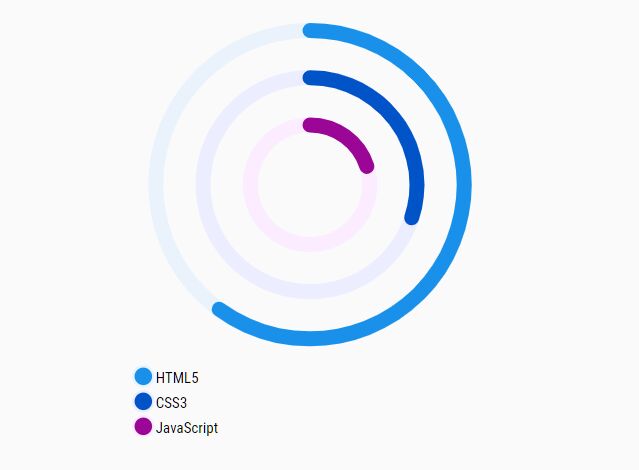
Create A Stacked Donut Chart With radialBar Plugin
- Chart & Graph - 4323 ViewsradialBar is a tiny jQuery plugin for rendering multiple SVG-based concentric circles to visualize your percentage data as a stacked donut chart.

Dynamic Flat Block Chart Plugin With jQuery - TimelineHeatmap
- Chart & Graph - 3580 ViewsThe Flat Block Chart Plugin dynamically generates a horizontal timeline-style heat map where the individual values contained in a 3D or 2D matrix are represented as flat clickable blocks.

Elegant SVG Pie & Donut Chart Plugin - listtopie.js
- Chart & Graph - 7837 Viewslisttopie.js is a jQuery pie chart plugin that makes uses of snap.svg to render an elegant, customizable, animated, nice-looking pie & donut charts for your statistic data.
jQuery Plugin For Making Interactive Charts And Maps - FusionCharts
- Chart & Graph - 11476 ViewsFusionCharts is a jQuery plugin for adding interactive charts and maps to your website.
Simple Animated Column Chart In JavaScript - Barchart.js
- Chart & Graph - 2724 ViewsBarchart.js is a tiny and easy JavaScript plugin to render an animated column chart from an array of n data arrays you provide.
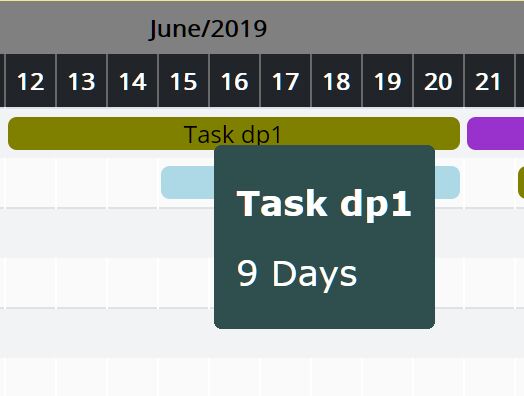
Easy Responsive Gantt Chart With jQuery And Moment.js
- Chart & Graph - 7393 Viewseasy-gantt is an easy responsive, dynamic, scrollable, multi-language Gantt chart plugin designed for planning, viewing, tracking tasks in a project.

Subway Map Creator With jQuery And Canvas - subwayMap
- Chart & Graph - 8848 ViewssubwayMap is a jQuery plugin that uses HTML5 canvas to draw a dynamic, customizable, metro map-style graphs and infographics on the web page.
Simple Plain Bar (Column) Chart In jQuery - bar-chart.js
- Chart & Graph - 1744 ViewsA tiny yet fully customizable jQuery chart plugin which helps you draw a plain vertical bar (column) chart form a JS array or an object containing key-value pairs.