Tiny Animated Chart Plugin For jQuery - simple-chart
| File Size: | 7.34 KB |
|---|---|
| Views Total: | 7573 |
| Last Update: | |
| Publish Date: | |
| Official Website: | Go to website |
| License: | MIT |
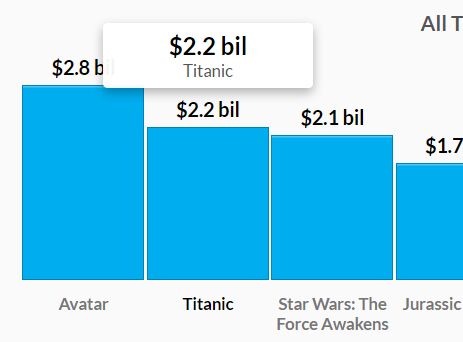
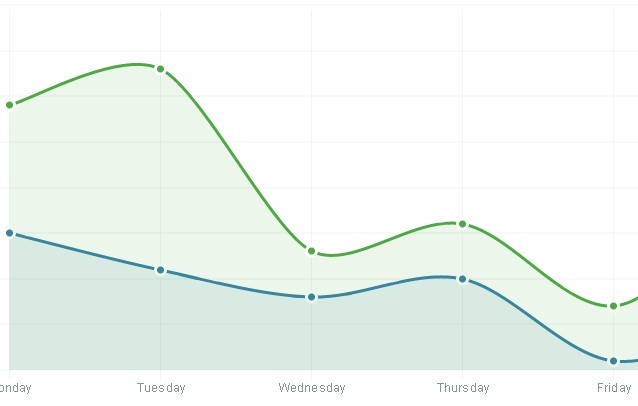
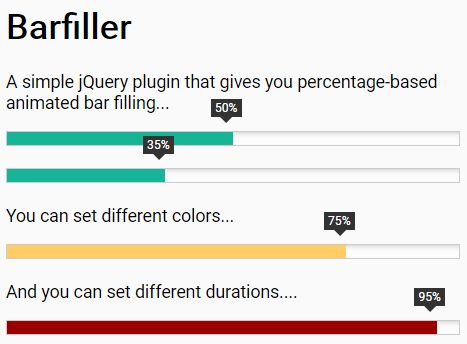
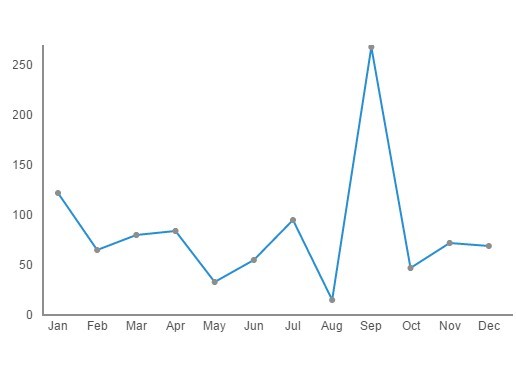
A simple, lightweight, dynamic, responsive, flexible, animated and cross-browser jQuery chart plugin that currently supports 5 chart types: progress, bar, waterfall, step and column.
Simple-chart is now Neo Charts. It has been completely rewritten it as a vanilla JS library. Grab the latest version here.
How to use it:
1. Put jQuery library together with the jQuery simple-chart's JavaScript and CSS files into your webpage.
<link rel="stylesheet" href="simple-chart.css">
<script src="//code.jquery.com/jquery.min.js"></script>
<script src="simple-chart.js"></script>
2. Create a container element to place your chart.
<div class="chart-container"></div>
3. Render a default chart with your own data in the container element:
$('.chart-container').simpleChart({

  item: {
    label: ['First Label'], // string
    value: [15], //integer
    outputValue: [], // Optimized values: instead of 10240 bytes you can output 10kb if you provide the array
    color: ['#333'],
    prefix: '',
    suffix: '',
    decimals: 2,
    height: null,
    render: {
      size: 'relative', /* Relative - the height of the items is relative to the maximum value */
      margin: 0,
      radius: null
    }
  },

})
4. More configuration options to customize your chart.
$('.chart-container').simpleChart({

  // chart title
  title: {
    text: 'Simple Chart',
    align: 'right'
  },

  // progress, bar, waterfall, column, step
  type: 'column',

  // in px or percentage
  layout: {
    width: '100%',
    height: '300px'
  }

})
Changelog:
2020-03-13
- JS Updated
This awesome jQuery plugin is developed by andygongea. For more Advanced Usages, please check the demo page or visit the official website.