jQuery Chart & Graph Plugins
Download Free jQuery Pie Chart, Bar Chart, Donut Chart, Line Chart and other data visualization tools & plugins at our jQuery Chart & Graph Section. Page 4 .
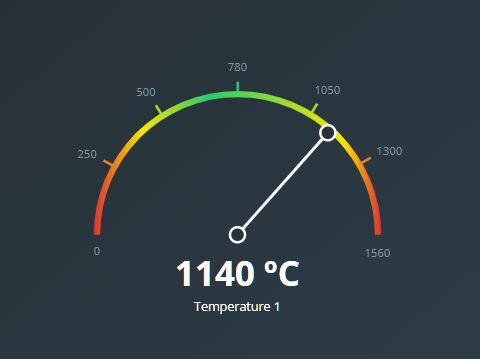
Graphical Gauge Meter With jQuery and Dx.js
- Chart & Graph - 16425 ViewsAn elegant, animated, graphical gauge meter/chart that uses jQuery and dx.js libraries for SVG drawing.
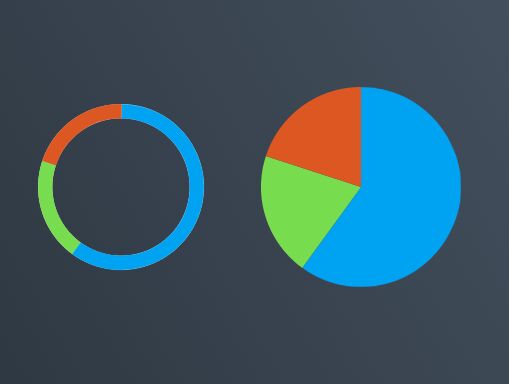
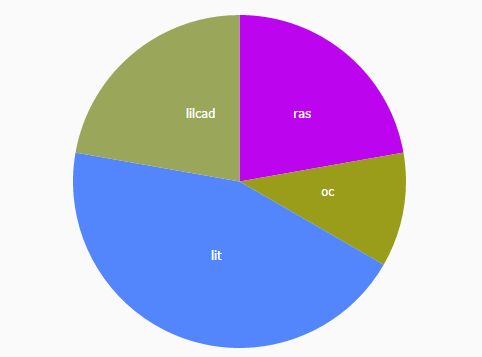
Basic SVG Chart Plugin For jQuery - jChart
- Chart & Graph - 11013 ViewsjChart is an easy-to-use jQuery plugin for rendering SVG based, vector shaped pie & donut charts that display each value as a part of a pie or donut.
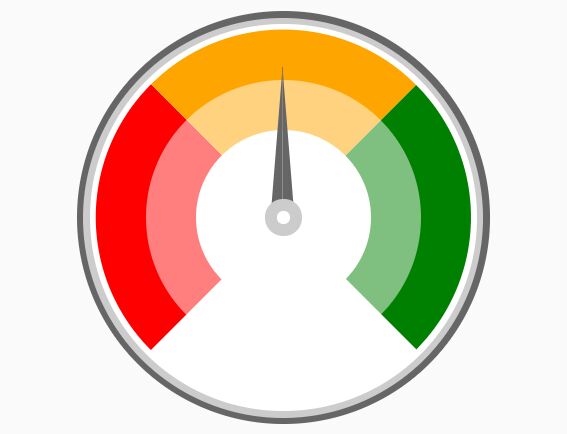
Create A Flat Barometer With jQuery And CSS/CSS3 - Barometer.js
- Chart & Graph - 10667 ViewsBarometer.js is a small jQuery plugin that helps you render a basic flat barometer & gauge interface to measure temperature, humidity, air pressure or anything you can imagine.
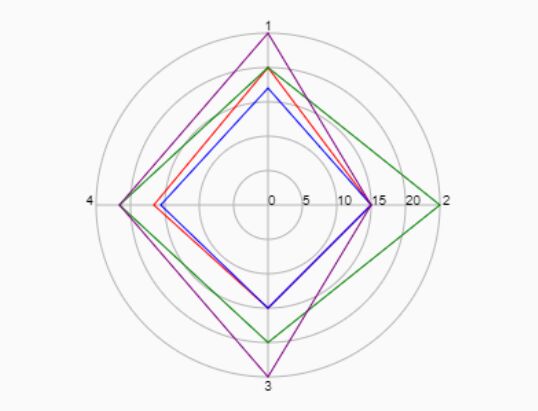
Dynamic Customizable Radar Chart In JavaScript - jQuery radarGraph.js
- Chart & Graph - 2245 ViewsA small jQuery plugin which dynamically renders a customizable, canvas-based radar chart (radar graph, radar diagram) with legends from JavaScript objects.
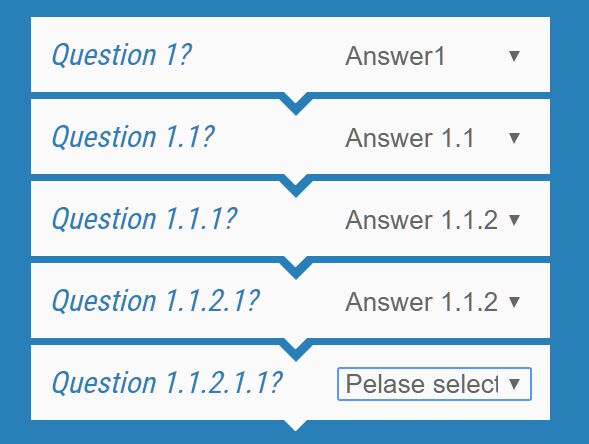
SEO-friendly Decision Tree jQuery Plugin - DecisionSelect
- Chart & Graph - 2129 ViewsA small, configurable, SEO-friendly jQuery decision tree plugin that transforms nested HTML lists into an interactive decision tree with select elements.
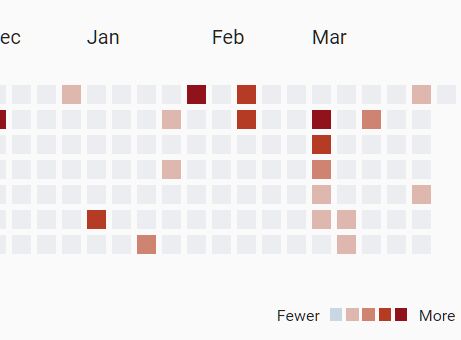
Github Style Heatmap Graph Plugin With jQuery - Calmosaic
- Chart & Graph - 3042 ViewsCalmosaic (Calendar Mosaic) is a jQuery plugin that dynamically renders a customizable calendar heatmap for representing time series data. Inspired by Github's contribution chart.

Interactive Bar/Column Chart Plugin With jQuery And D3.js
- Chart & Graph - 6851 ViewsAn animated, interactive, dynamic, configurable, fully responsive bar/column chart plugin built using jQuery and D3.js.
Draw Customizable Polylines Using jQuery And Canvas - polyline.js
- Chart & Graph - 2058 Viewspolyline.js is a jQuery plugin/jQuery UI widget that lets you draw polylines with dots on an HTML canvas to represent routes, paths, data series, etc.
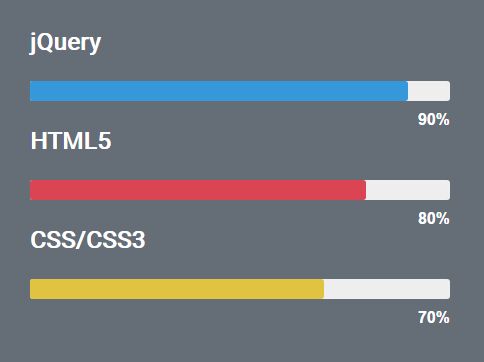
Minimal Customizable jQuery Progress Bar Plugin - LineProgressbar
- Chart & Graph - 19779 ViewsLineProgressbar is a super tiny jQuery plugin that helps you create horizontal, animated, line chart-style progress bars with or without percentage values.
jQuery Plugins To Visualize Date Using D3.js - Noterik DataVisualizations
- Chart & Graph - 11001 ViewsA set of jQuery plugin which takes advantage of D3.js library to visualize your plain data into animated, dynamic, interactive pie/bar charts or a word cloud.
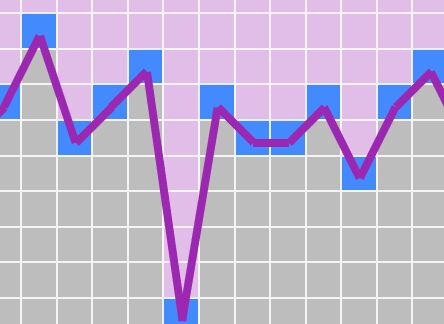
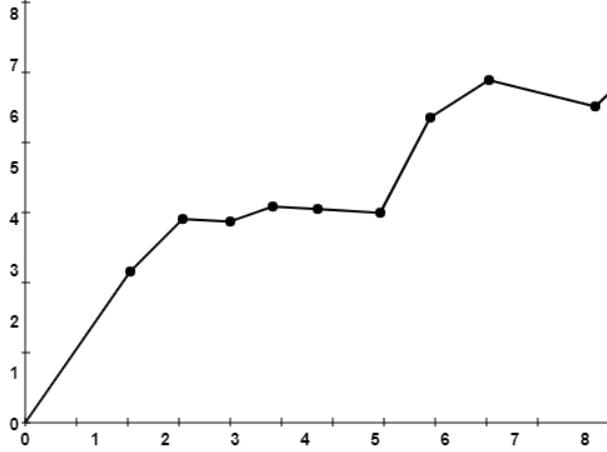
Dynamic Line Chart With Grid Lines - jQuery LineChart
- Chart & Graph - 1687 ViewsA lightweight and easy-to-use jQuery plugin to dynamically render a line chart with marks, gridlines and interlaced colors.

Dynamic Chart Generator With jQuery And D3.js - D3-Instant-Charts
- Chart & Graph - 7441 ViewsD3-Instant-Charts is a jQuery chart plugin which helps you dynamically generate customizable, SVG-based bar and line charts from JSON data using the latest d3.js library.

Smooth Progress Gauge Plugin With jQuery And CSS3 - simpleGauge.js
- Chart & Graph - 10394 ViewssimpleGauge.js is a small jQuery plugin which lets you create minimal, clean, smooth gauge meters to represent percentage values on the webpage.
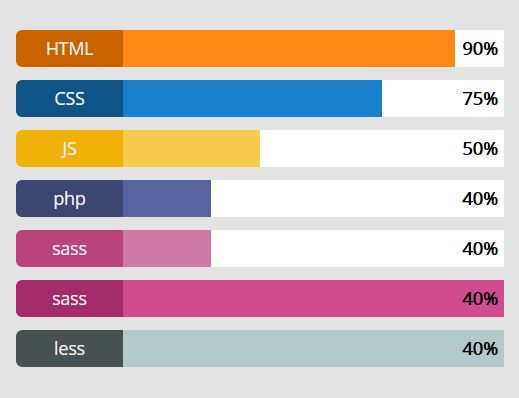
Lightweight Animated Skills Bar In jQuery - an-skill-bar
- Chart & Graph - 5484 ViewsThe an-skill-bar jQuery plugin lets you create animated skill/experience bars which can be used for online resumes.
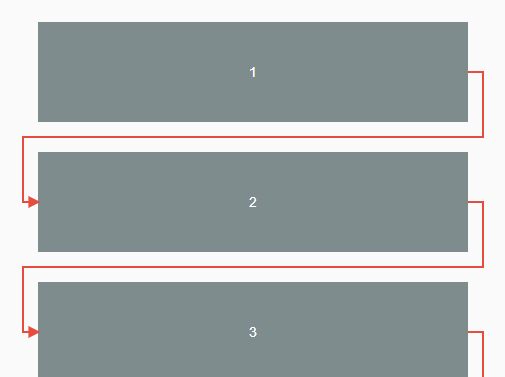
Basic Flow Chart Plugin With jQuery And Bootstrap - simple-flow
- Chart & Graph - 18123 ViewsA simple, lightweight flow chart plugin which uses Bootstrap grid system to create a minimal, responsive workflow with SVG based connection lines and arrows on the web page.
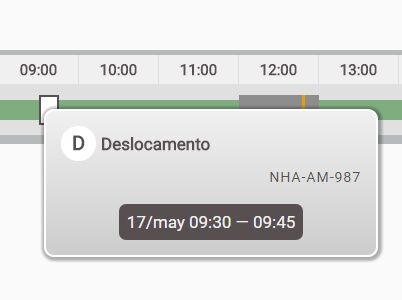
Stacked Horizontal Gantt Chart Plugin With jQuery
- Chart & Graph - 11624 ViewsA simple, configurable jQuery plugin for creating a timeline-style gantt chart to illustrates a project schedule with custom markers and stacked activities.
Modular Extensible Plotting Library For jQuery - jqPlot
- Chart & Graph - 2874 ViewsjqPlot is a jQuery plotting plugin for creating a variety of highly customizable, AJAX enabled, HTML5 canvas based charts & graphs to visualize your data.
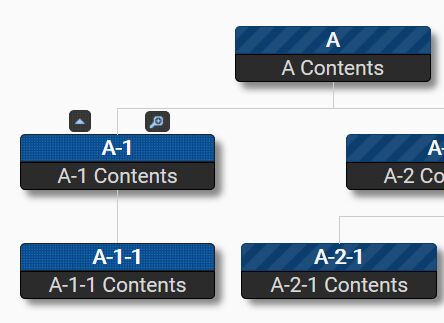
Dynamic Family Tree/Organization Chart Plugin - jHTree
- Chart & Graph - 41747 ViewsThe jHTree plugin helps you dynamically renders an animated, draggable, zoomable, expandable, collapsible and themeable Family Tree/Organization Chart️ from hierarchical data defined in the JSON.

Single Elimination Tournament Bracket Generator In jQuery - Gracket.js
- Chart & Graph - 11804 ViewsGracket.js is a small jQuery bracket plugin to dynamically generate a customizable single-elimination tournament bracket on the webpage.
Create Reusable Highcharts Graphs With jQuery
- Chart & Graph - 3090 ViewsReusable Highchart is a jQuery plugin that helps developers to create reusable, interactive charts/graphs using the popular Highcharts library.