Touch-enabled Histogram Slider Plugin For jQuery
| File Size: | 17.3 KB |
|---|---|
| Views Total: | 6452 |
| Last Update: | |
| Publish Date: | |
| Official Website: | Go to website |
| License: | MIT |
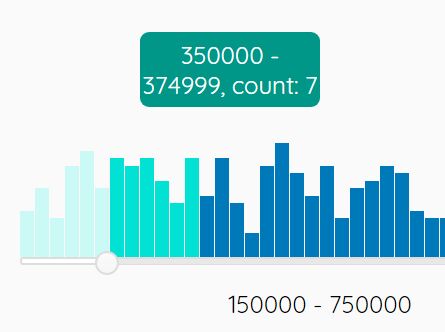
A simple, customizable, mobile-friendly, jQuery/jQuery UI based histogram slider component which can be used for exploring distributions of things within data visualizations.
How to use it:
1. Include the necessary jQuery and jQuery UI libraries on the webpage.
<script src="//code.jquery.com/jquery-3.2.1.js"></script>
<script src="//code.jquery.com/ui/1.12.1/jquery-ui.js"></script>
<link rel="stylesheet" href="//code.jquery.com/ui/1.12.1/themes/flick/jquery-ui.css">
2. Include the OPTIONAL jQuery UI Touch Punch to enable the touch events for jQuery UI.
<script src="//cdnjs.cloudflare.com/ajax/libs/jqueryui-touch-punch/0.2.3/jquery.ui.touch-punch.min.js"></script>
3. Download and include the 'histogram.slider.js' after jQuery.
<script src="histogram.slider.js"></script>
<link rel="stylesheet" href="histogram.slider.css">
4. Initialize the plugin and push your own data into the histogram.
<div id="histogramSlider"></div>
var numberOfBins = 40,
data = {
  "items": []
},
// programmatically generate the data for the histogram
for (var i = 0; i < 300; i++) {
  var randomNumber = Math.floor(Math.random() * numberOfBins) + 1;
  var randomNumber2 = Math.floor(Math.random() * 12000);
  var randomValue = ((1000000 / numberOfBins) - randomNumber2) * randomNumber;
  data.items.push({ "value": randomValue });
}
$("#histogramSlider").histogramSlider({
  leftHandleValue: 150000,
  rightHandleValue: 750000,
  data: data,
  optimalRange: 300000,
  numberOfBins: numberOfBins,
  showTooltips: true,
  showValues: true
});
5. Apply your own CSS styles to the histogram slider.
#histogramSlider {
  max-width: 400px;
  margin: auto;
}

.display-none { display: none; }

.bin {
  position: relative;
  margin-right: 1px;
}

.in-range { background-color: #0079BA; }

.out-of-range { background-color: #DBE0E2; }

.optimalRange.in-range { background-color: #01E2D4; }

.optimalRange.out-of-range { background-color: #caf9f6; }

.ui-slider-horizontal { height: .2em; }

.ui-slider .ui-slider-handle {
  width: .8em;
  height: .8em;
  border-radius: 50%;
}
6. Customize the histogram slider with the following parameter options.
{
  sliderMin: 0,
  sliderMax: 1000000,
  leftHandleValue: 0,
  rightHandleValue: 1000000,
  backgroundColorInRange: "#0079BA",
  backgroundColorOutOfRange: "#DBE0E2",
  height: 200,
  optimalRange: 0,
  numberOfBins: 40,
  showTooltips: false,
  showValues: true
}
Change log:
2017-07-11
- use Bootstrap Slider instead of jQuery UI.
2017-07-09
- Brought 1px bar margin back
- Added 'histogram.slider.css'.
This awesome jQuery plugin is developed by drewhaines. For more Advanced Usages, please check the demo page or visit the official website.


