HTML5 Canvas Bar Indicator Plugin For jQuery - Jindicator
| File Size: | 13.6 KB |
|---|---|
| Views Total: | 2260 |
| Last Update: | |
| Publish Date: | |
| Official Website: | Go to website |
| License: | MIT |
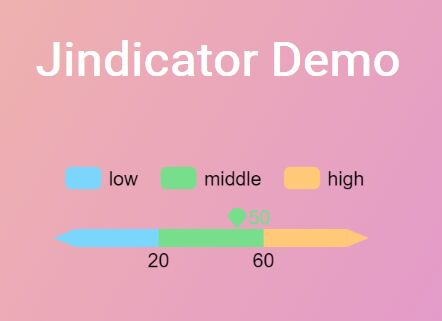
Jindicator is a jQuery plugin that makes it easy to draw a dynamic, highly customizable bar chart/indicator on an HTML5 canvas element.
How to use it:
1. Load the jQuery Jindicator plugin's script after jQuery library (slim build is recommended) like this:
<script src="//code.jquery.com/jquery-3.2.1.slim.min.js"></script>
<script src="jquery.JIndicator.js"></script>
2. Create a placeholder element for the canvas bar indicator.
<div id="demo"></div>
3. Initialize the plugin and define your own data set to be represented in the bar indicator.
$('#demo').JIndicator({

  // scales
  barValues: [, 20, 60,],

  // current value
  indicatorValue: 50

});
4. Override the following options to change the default appearance of the bar indicator.
$('#demo').JIndicator({

  canvasHeight: 70,
  canvasWidth: 500,
  startX: 10,
  barHeight: 12,
  barWidth: 150,
  barColor: {
    left: '#7BD6FD',
    middle: '#77DE8B',
    right: '#FFC977'
  },
  indicatorColor: 'auto',
  numberText: {
    color: '#000000',
    fontSize: 13,
    fontFamily: 'Arial',
    align: 'left',
    fontHeight: 12
  }

});
5. Customize the legends as per your needs:
$('#demo').JIndicator({

  legend: {
    data: ['low', 'middle', 'high'],
    textColor: '#000000'
  },
  legendHeight: 15,
  legendProperty : {
    height: 15,
    width: 24,
    margin: 15,
    radius: 4
  }

});
This awesome jQuery plugin is developed by chenxing2. For more Advanced Usages, please check the demo page or visit the official website.


