Customizable Liquid Bubble Chart With jQuery and Canvas
| File Size: | 17.5 KB |
|---|---|
| Views Total: | 19863 |
| Last Update: | |
| Publish Date: | |
| Official Website: | Go to website |
| License: | MIT |
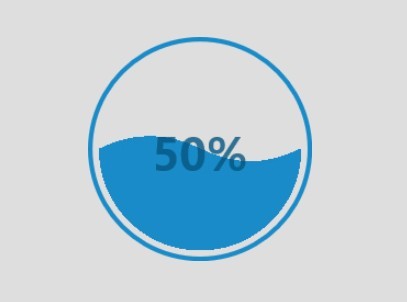
A super tiny yet customizable jQuery plugin used to present your numeric data in a Canvas liquid bubble chart with a water fill animation. Useful for preloader, progress bar, loading indicator.
How to use it:
1. Load jQuery library and the jQuery Water Bubble Chart plugin at the end of your document.
<script src="//code.jquery.com/jquery-2.1.4.min.js"></script>
<script src="waterbubble.js"></script>
2. Create an Canvas element for the liquid bubble chart.
<canvas id="demo"></canvas>
3. Draw a default liquid bubble chart on the Canvas element.
$('#demo').waterbubble();
4. Customization options.
$('#demo').waterbubble({

  // bubble size
  radius: 100,

  // border width
  lineWidth: undefined,

  // data to present
  data: 0.5,

  // color of the water bubble
  waterColor: 'rgba(25, 139, 201, 1)',

  // text color
  textColor: 'rgba(06, 85, 128, 0.8)',

  // custom font family
  font: '',

  // show wave
  wave: true,

  // custom text displayed inside the water bubble
  txt: undefined,

  // enable water fill animation
  animation: true

});
Change log:
2016-03-08
- fixed for Chrome
2015-09-13
- fixed a bug
2015-09-09
- fixed a bug
This awesome jQuery plugin is developed by miafan23. For more Advanced Usages, please check the demo page or visit the official website.


