Circular Pie Chart & Progress Bar Plugin with jQuery and Canvas
| File Size: | 5.29 KB |
|---|---|
| Views Total: | 32155 |
| Last Update: | |
| Publish Date: | |
| Official Website: | Go to website |
| License: | MIT |
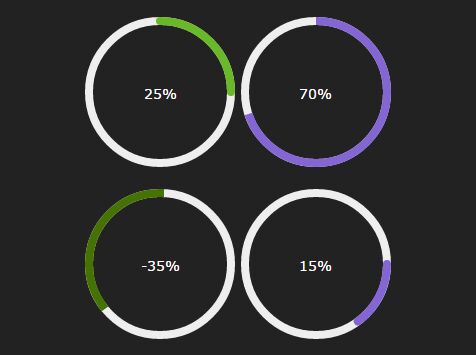
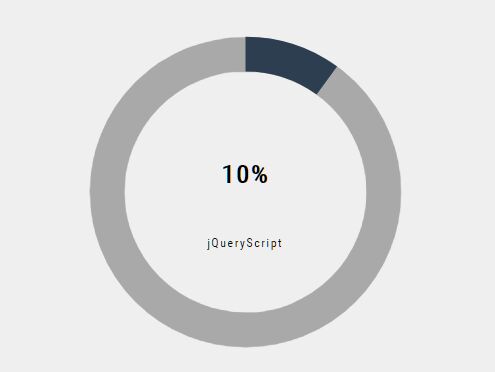
A dead simple jQuery plugin that uses HTML5 canvas to render animated, customizable, circular pie chart for representing percentage values or progress status.
How to use it:
1. Load the latest version of jQuery library and the jQuery pie chart plugin at the end of the document.
<script src="//code.jquery.com/jquery-2.1.4.min.js"></script>
<script src="js/pie-chart.js"></script>
2. Define the percentage value using data-percent attribute.
<div id="example" data-percent="25">
</div>
3. Initialize the plugin to draw a default pie chart / progress bar on the webpage.
$('#example').pieChart();
4. Show the current percentage value inside the pie chart / progress bar.
<div id="example"  class="pie-title-center" data-percent="25">
  <span class="pie-value"></span>
</div>
.pie-title-center {
  display: inline-block;
  position: relative;
  text-align: center;
}

.pie-value {
  display: block;
  position: absolute;
  font-size: 14px;
  height: 40px;
  top: 50%;
  left: 0;
  right: 0;
  margin-top: -20px;
  line-height: 40px;
}
5. All configuration options with default values.
// bar color
barColor: '#ef1e25',

// background color
trackColor: '#f9f9f9',

// line width
lineWidth: 3,

// chart size
size: 110,

// the origin of coordinates is at the top
rotate: 0,

// custom animation
animate: {
  duration: 1000,
  enabled: true
},

// jquery easing function
easing: function (x, t, b, c, d) {
  t = t / (d / 2);
  if (t < 1) {
    return c / 2 * t * t + b;
  }
  return -c / 2 * ((--t) * (t - 2) - 1) + b;
},

// show the percent digital animate
onStep: function (from, to, currentValue) {
  return;
},
This awesome jQuery plugin is developed by chenruchang. For more Advanced Usages, please check the demo page or visit the official website.