Simple Canvas Based Donut Chart Plugin With jQuery - Sweet Donut
| File Size: | 7.4 KB |
|---|---|
| Views Total: | 6024 |
| Last Update: | |
| Publish Date: | |
| Official Website: | Go to website |
| License: | MIT |
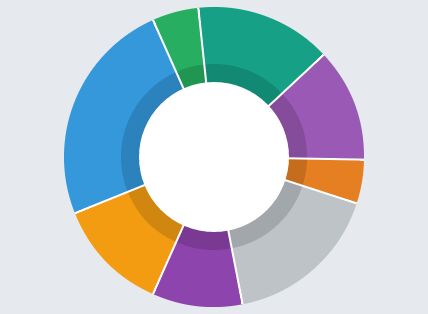
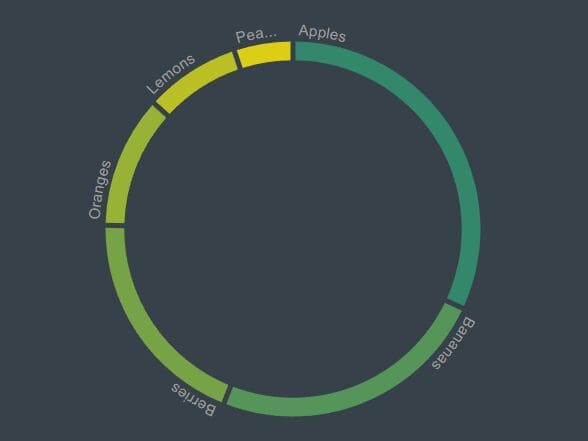
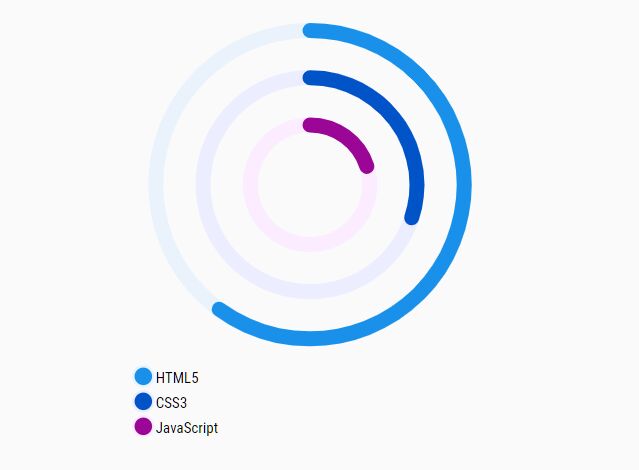
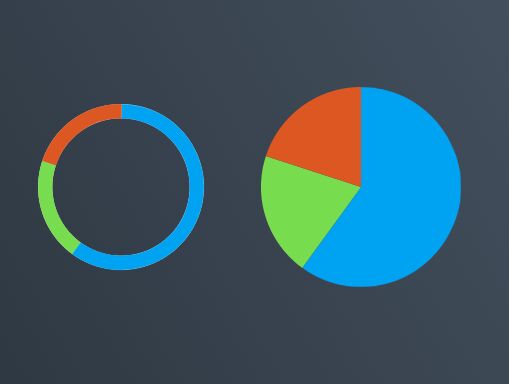
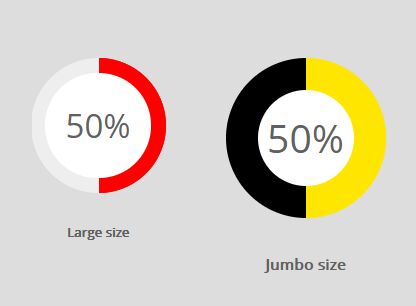
Sweet Donut is a simple jQuery plugin which renders a pretty nice doughnut chart on an HTML5 canvas element to present an array of numeric values.
How to use it:
1. Make sure to load the jQuery Sweet Donut plugin's script after jQuery library:
<script src="//code.jquery.com/jquery-3.0.0.slim.min.js"></script>
<script src="js/sweet-donut.js"></script>
2. Create an HTML5 canvas in which you want to draw the doughnut chart.
<canvas id="donut-chart"></canvas>
3. Prepare the data you want to present.
var props;
props = {
  "data": [2,7,4,5,10, 2,6,5]
};
4. Call the function to draw the doughnut chart.
$('#donut-chart').drawDonut(props);
5. Full configuration options.
// an array of colors
// otherwise random colors will be chosen.
"colors": ["#3498db", "#d35400", "#1abc9c"],

// the color shadiness on the inner donut edge
"shade_factor": "-14",

// the width of shady area
"shade_area_percent": "0.31",

// how big the inner blank circle is.
"inner_area_factor": "0.5"
This awesome jQuery plugin is developed by matixmatix. For more Advanced Usages, please check the demo page or visit the official website.