Simple Plain Bar Chart Plugin With jQuery - barCharts
| File Size: | 4.76 KB |
|---|---|
| Views Total: | 9833 |
| Last Update: | |
| Publish Date: | |
| Official Website: | Go to website |
| License: | MIT |
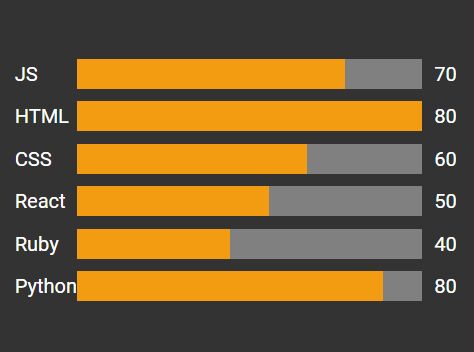
barCharts is a very small jQuery plugin used to render an animated, horizontal or vertical bar chart / progress bar using plain HTML and CSS.
How to use it:
1. Include the jquery.barCharts.css in the head section to style the bar chart.
<link href="jquery.barCharts.css" rel="stylesheet">
2. The required html structure for the bar chart. You need to specify the numeric value using data-value attribute as this:
<div class="barChart">
  <div class="barChart__row" data-value="80">
    <span class="barChart__label">jQuery</span>
    <span class="barChart__value">17</span>
    <span class="barChart__bar"><span class="barChart__barFill"></span></span>
  </div>
  <div class="barChart__row" data-value="60">
    <span class="barChart__label">Label 2</span>
    <span class="barChart__value">ReactJS</span>
    <span class="barChart__bar"><span class="barChart__barFill"></span></span>
  </div>
</div>
3. Include jQuery library and the jquery.barCharts.js at the bottom of the webpage.
<script src="//code.jquery.com/jquery.min.js"></script>
<script src="jquery.barChart.js"></script>
4. Optionally, you can load the jQuery easing plugin for more easing effects.
<script src="jquery.easing.min.js"></script>
5. Initialize the plugin to render a bar chart in the webpage.
$('.barChart').barChart();
6. Plugin's default customization options.
$('.barChart').barChart({

  // horizontal or vertical
  type: 'horizontal',

  // easing effect
  easing: 'swing',

  // animation speed
  animationSpeed: 2000,

  // row class
  rowClass: 'barChart__row',

  //  bar fill class
  fillClass: 'barChart__barFill'

});
Change log:
2016-08-12
- JS update
This awesome jQuery plugin is developed by bryn500. For more Advanced Usages, please check the demo page or visit the official website.