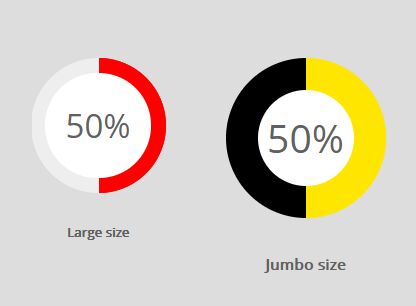
Vector Shaped Doughnut Chart Plugin With jQuery - svgDoughnutChart.js
| File Size: | 16.1 KB |
|---|---|
| Views Total: | 6168 |
| Last Update: | |
| Publish Date: | |
| Official Website: | Go to website |
| License: | MIT |
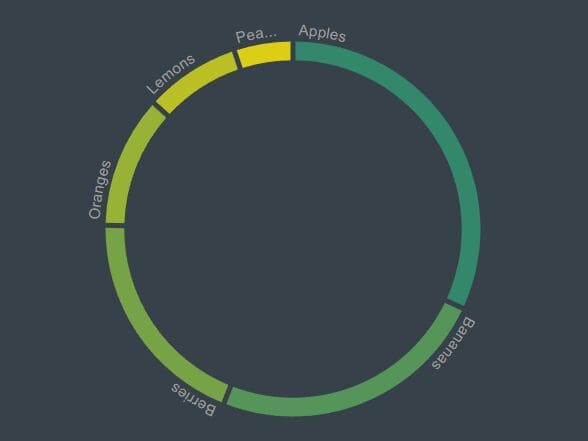
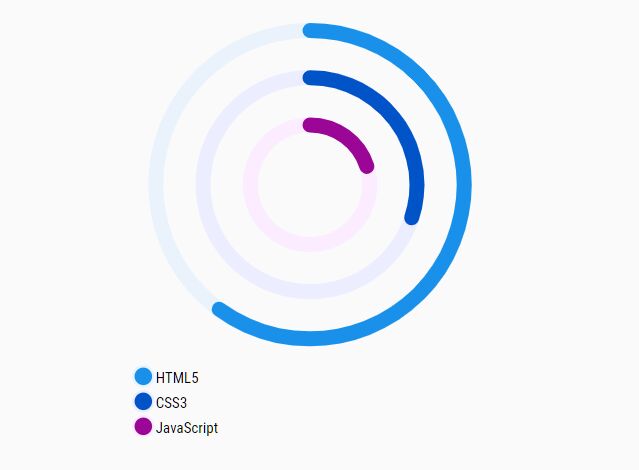
svgDoughnutChart.js is a really simple jQuery charting plugin which makes use of SVG to plot your data as customizable, vector shaped doughnut graphs. Perfect for presenting/visualizing your percentage values in a graphic way.
How to use it:
1. Load the latest version of jQuery and jQuery svgDoughnutChart.js script in the html file.
<script src="//code.jquery.com/jquery-3.1.0.min.js"></script>
<script src="dist/jquery.svgDoughnutChart.js"></script>
2. Create a container element for the doughnut chart.
<div id="container"></div>
3. The JavaScript to render a basic doughnut chart inside the container.
$('#container').doughnutChart({
  percentage: 70,
});
4. Customize the doughnut chart by overriding the following default options.
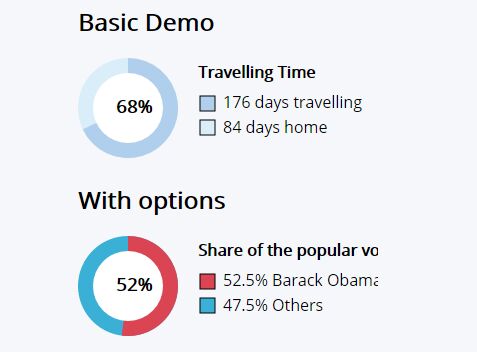
$('#container').doughnutChart({
  positiveColor: 'rgb(175, 207, 236)',
  negativeColor:  'rgb(217, 238, 248)',
  backgroundColor: "white",
  percentage : 68,
  size: 100,
  doughnutSize: 0.35,
  innerText: "68%",
  innerTextOffset: 12,
  Title: "Travelling Time",
  positiveText: "176 days travelling",
  negativeText : "84 days home"
});
This awesome jQuery plugin is developed by JordiCorbilla. For more Advanced Usages, please check the demo page or visit the official website.