Animated Bipolar Bar Chart Plugin With jQuery - cssbipolarchart
| File Size: | 6.54 KB |
|---|---|
| Views Total: | 1835 |
| Last Update: | |
| Publish Date: | |
| Official Website: | Go to website |
| License: | MIT |
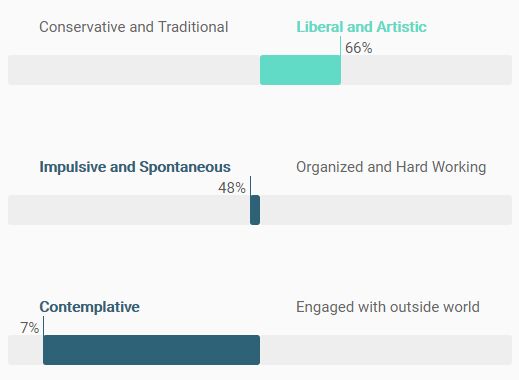
cssbipolarchart is a jQuery plugin which uses plain HTML5 and CSS to draw animated bipolar dual-Y bar charts on the webpage.
How to use it:
1. Load the latest version of jQuery library together with the jQuery cssbipolarchart plugin's JavaScript and CSS files into the html page.
<link rel="stylesheet" href="cssBipolarChart.css">
<script src="//code.jquery.com/jquery-3.0.0.min.js"></script>
<script src="cssBipolarChart.js"></script>
2. Create a DIV container where you want to place the bipolar chart.
<div id="example">
</div>
3. Prepare your data as follows:
var sampleData = [
    ["left label 1", "right label 1", 0.1],
    ["left label 2", "right label 2", 0.2],
    ["left label 3", "right label 3", 0.3]
    ...
]
4. The JavaScript to draw a bipolar chart inside the DIV container you just created:
$("#example").drawCSSBipolarChart({
  data: sampleData,
  bipolar: true
})
5. Default configuration options.
$("#example").drawCSSBipolarChart({
  colors: {  left: '#61dac6', right: '#2E6276'},
  simpleBar: false,
  bothSides: false,
  bipolar: false,
  data: {},
  chartContainer: '<div class="chart-horiz-container"></div>',
  ul: '<ul class="chart-horiz"></ul>',
  li: '<li></li>',
  divPos: '<div class="posValue"></div>',
  divNeg: '<div class="negValue"></div>',
  spanBar: '<div class="bar"></div>',
  spanValue: '<div class="number-label"></div>',
  spanValueLabel: '<div class="valueLabel"></div>',
  transitionDelay: 3000
})
This awesome jQuery plugin is developed by srivig. For more Advanced Usages, please check the demo page or visit the official website.


